
Figures & data
Table 1. Overview of nitrate and nitrite concentrations in the different exposure scenarios.
Table 2. Overview of nitrate and nitrite concentrations in drinking water measured in on average 185 Dutch regions between 2012–2017.
Figure 1. Mean and high (upper 5th percentile) exposure to nitrite resulting from the combined exposure to nitrate and nitrite from all dietary sources (including confidence interval) as a function of age. Lower panel describes the mean total dietary exposure and upper limits across all ages (1–79 years). Scenario 1 assumes the intake of nitrate and nitrite at mean concentration in food and at the national mean concentrations in drinking water. Scenario 2 assumes the intake of nitrate and nitrite at mean concentrations in food and high regional nitrite level and the national mean concentration for nitrate in drinking water. Scenario 3 assumes the intake of nitrate and nitrite at mean concentrations in food and high regional nitrate concentration and the national mean concentration for nitrite in drinking water. Scenario 4 assumes the intake of nitrate and nitrite at mean concentrations in food and possible future high regional nitrate concentration and the current national mean level for nitrite in drinking water.
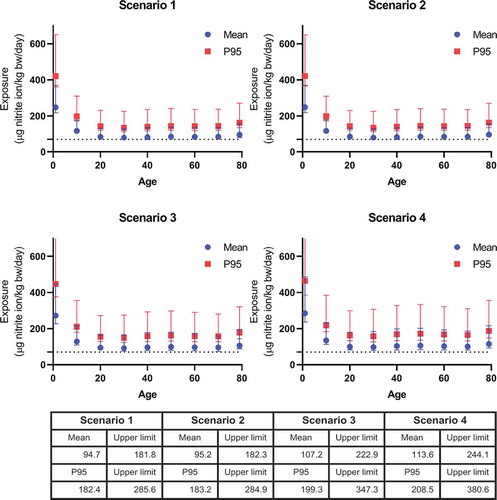
Figure 2. The relative contribution of food groups to the total exposure of nitrite resulting from the combined dietary exposure to nitrate and nitrite from all dietary sources (food additive use, natural occurrence and as contaminant in food) for the Dutch population aged 1 − 79 years assuming four different scenarios for nitrate and nitrite concentrations in drinking water.
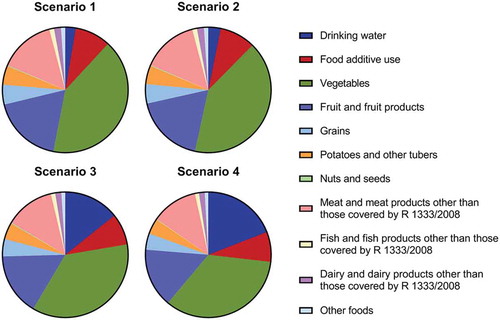
Table 3. Relative contribution of food categories to the exposure of nitrite resulting from the combined exposure (mean and P95) of nitrate and nitrite due to food additive use and contaminants in vegetables for the Dutch population aged 1 − 79 years.
Table 4. Overview of uncertainties in the current exposure assessment that could not be quantified and their assessed subsequent qualitative impact on exposure.