Figures & data
Figure 1. Experimental flow diagram for in-vitro biocontrol study of aflatoxin mitigation (micro-laboratory based) and metabolite determination using bio-analytical techniques. Undamaged maize kernels were surface sterilised and co-infected with a known concentration of atoxigenic isolate KSM012 and/or aflatoxigenic isolates KSM014 of A. flavus at varying proportions prior to metabolite extraction for TLC screening and LCMS/MS analysis. The isolates were cultured on inducing and non-inducing media (YES: yeast extract sucrose agar; YEP: yeast extract peptone agar; Tox: toxigenic and Atox: atoxigenic respectively; TLC: thin layer chromatography; LCMS/MS: liquid chromatography coupled to mass spectrometry)
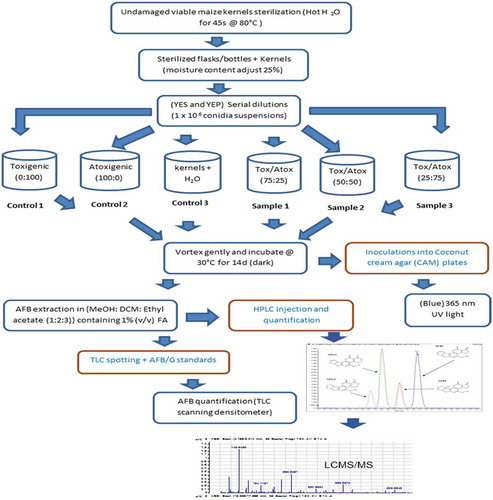
Table 1. Percentage extraction yield at varying parameters (solvent proportions, bead beating, time frame and sonication)
Figure 2. Standard curves of various aflatoxin standards used in the current research (AFG2, AFG1, AFB2 and AFB1) respectively showing linear regression and equation
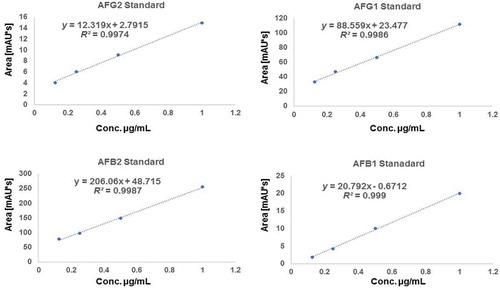
Figure 3. HPLC chromatographic separations. Standard chromatogram achieved after the analysis of aflatoxins standard mix with certificated concentration of 1.70 µg/mL for AFG2 and AFB2 and 5.86 µg/mL for AFG1 and AFB1 at wavelength 320 nm
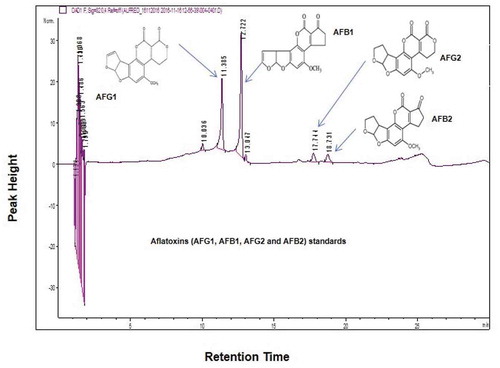
Figure 4. HPLC chromatographic separations for (a) isolate KSM012 (non-toxigenic strain) confirmed the possibility of its non-toxigenicity and (b) Aflatoxigenic isolate KSM014 (toxigenic strain) achieved at wavelength 365 nm respectively
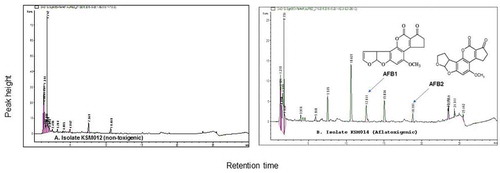
Figure 5. MS/MS spectra and fragmentation pathway showing mycotoxin metabolites and their derivatives identified from eight different samples (KSM014, KSM015, KSM018, KSM019, HB023, MC033, MC037, MC038) isolated from four different climatic regions of Kenya based on electrospray ionisation mass-to-charge (m/z) ratio and targeted mass. The mycotoxins identified (AFG1: aflatoxin G1; AFG2: aflatoxin G2; AFB2: aflatoxin B2; AFM1: aflatoxin M1; AFM2: aflatoxin M2 and OTA: ochratoxin A). (MC: Makueni; HB: Homa Bay; KSM: Kisumu respectively)
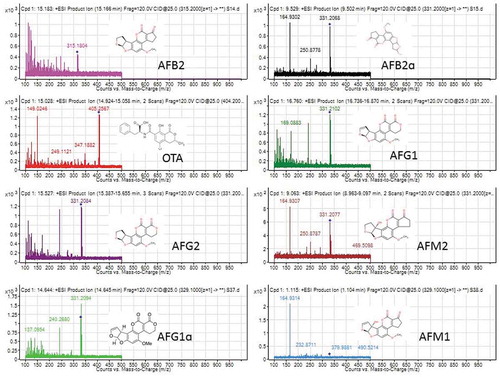
Table 2. Metabolites identified by formula mass, possible compounds, monoisotopic masses and other chromatographic properties
Table 3. Metabolites identified by targeted mass algorithm
Figure 6. Images of thin-layer chromatography plates (a) showing aflatoxin suspects or presence from the isolates in comparison to the standards of aflatoxins (b) the staining effects on TLC plate with p-anisaldehyde. Lanes: (1) Blank; (2) Standard; (3) G100/0; (4) G75/25; (5) G50/50; (6) G25/75; (7) G0/100; (8) K100/0; (9) K75/25; (10) K50/50; (11) K25/75; (12) K0/100. (atoxigenic/toxigenic. (G1: aflatoxin AFG1; G2: aflatoxin AFG2; B1: aflatoxin AFB1; B2: aflatoxin AFB2)
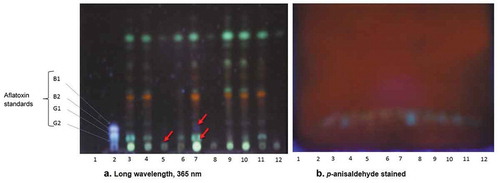
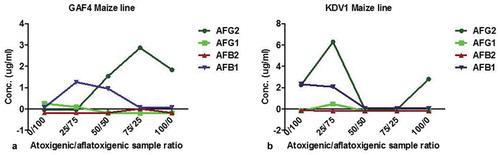
Figure 7. Analysis of high-performance liquid chromatography highlighting biocontrol strategy exhibited when two maize lines (KDV1 and GAF4) were co-infected with non-toxin producing (KSM012) and toxin-producing (KSM014) strains of Aspergillus flavus. At co-infection ratio (a) indicated by red arrow: 50:50; aflatoxin AFG2, AFB1 and at 75:25; AFG2 were detected whereas AFG1, AFB1 and AFB2 were not detected for GAF4 maize line respectively); (b) at 50:50 and 75:25) there was significant decrease in presence of both aflatoxins or no signals detected by HPLC on KDV1 maize line, an indication of probable complete inhibition of the aflatoxigenic isolate by atoxigenic counterpart. KDV1 maize line appeared more susceptible to Aspergillus flavus colonisation compared to GAF4. (AFG1: aflatoxin G1; AFG2: aflatoxin G2; AFB1: aflatoxin B1; AFB2: aflatoxin B2)