Figures & data
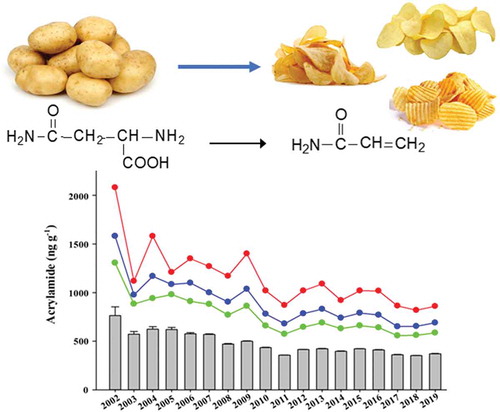
Table 1. Acrylamide (ng g−1) in samples of potato crisps over years, showing mean, standard error of mean (SE), number of observations (n), 85%, 90% and 95% quantiles (Q85, Q90 and Q95), maximum levels, and proportion (%) of samples containing greater than 750, 1000 and 2000 ng g−1. (a) Data provided by the European Snacks Association (ESA), compiled from data supplied by European manufacturers. (b) Data provided by the European Food Standards Agency (EFSA), compiled from data supplied by European Union Member States. (c) The yearly means for the ESA and EFSA data shown together, and the fold-difference
Figure 1. Overall mean acrylamide levels (ng g−1) in samples of potato crisps shown over years, with standard errors and trends in 85%, 90% and 95% quantiles. (a) European Snacks Association data for years 2002–2019, compiled from data supplied by European manufacturers. (b) European Food Safety Authority data for years 2011–2018, compiled from data supplied by European Union Member States
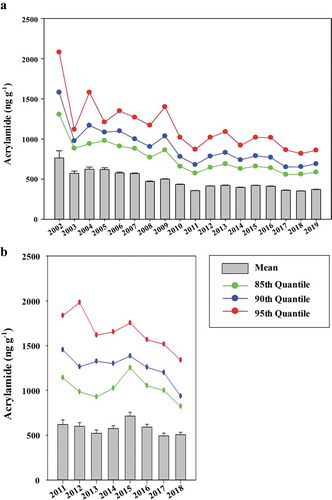
Table 2. Analysis of variance of European Snacks Association acrylamide data for samples of potato crisps from Europe for 2002 to 2019 to show differences between years. (a) Mean acrylamide (ng g−1) for each year on the natural log (to base e) scale and number of observations (n). (b) Least significant difference (LSD) values on 99686 degrees of freedom at the 5% (p < .05) level of significance. The value for a particular comparison of the means in Table 2 is given by reading along the appropriate row and up the appropriate column
Table 3. Analysis of variance of EFSA acrylamide data for potato crisps from 2011 to 2018 to show differences between years. (a) Mean acrylamide (ng g−1) for each year on the natural log (to base e) scale and number of observations (n). (b) Least significant difference (LSD) values on 2119 degrees of freedom at the 5% (p < .05) level of significance. The value for a particular comparison of the means is given by reading along the appropriate row and up the appropriate column
Figure 2. (a) Proportion (%) of samples of potato crisps containing more than 750 ng g−1 acrylamide (the Benchmark Level set for potato crisps in Commission Regulation (EU) 2017/2158 (European Commission Citation2017)) in European Snacks Association data for years 2002–2019. (b) Histogram of data on acrylamide in potato crisps (ng g−1) provided by the European Snacks Association for 2019, showing frequencies of observations within 50 ng g−1 bands. The Benchmark Level of 750 ng g−1 set in Commission Regulation (EU) 2017/2158 (European Commission Citation2017) is indicated. The percentage of observations greater than 750 ng g−1 is shown
Table 4. Number of observations (n), mean (ng g−1), standard error of mean (SE), 85%, 90% and 95% quantile (Q85, Q90 and Q95) values and proportion (%) of samples containing greater than 750 ng g−1 for acrylamide in samples of potato crisps from Europe for each month. (a) Data from 2002 to 2019 provided by the European Snacks Association (ESA), compiled from data supplied by European manufacturers. (b) Data from 2011 to 2018 provided by the European Food Standards Agency (EFSA), compiled from data supplied by European Union Member States
Table 5. Analysis of variance of European Snacks Association acrylamide data for samples of potato crisps from Europe for 2002 to 2019 to show differences between months. (a) Mean acrylamide (ng g−1) for each month on the natural log (to base e) scale and number of observations (n). (b) Least significant difference (LSD) values on 99692 degrees of freedom at the 5% (p < .05) level of significance. The value for a particular comparison of the means is given by reading along the appropriate row and up the appropriate column
Figure 3. Seasonality in acrylamide levels in samples of potato crisps from European Snacks Association data for years 2002–2019. (a) Mean acrylamide levels over time (2002–2019) with standard errors, plotted monthly. (b) Mean acrylamide levels per month over all years with standard errors and with trend in 85%, 90% and 95% quantiles. (c) Proportion of samples each month containing more than 750 ng g−1 acrylamide (the Benchmark Level set for potato crisps in Commission Regulation (EU) 2017/2158 (European Commission Citation2017)), over the period 2017–2019
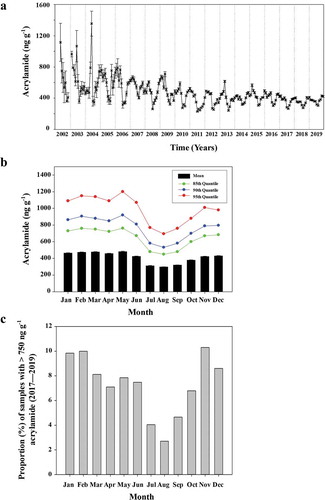
Table 6. Analysis of variance of EFSA acrylamide data for potato crisps from 2011 to 2018 to show differences between months. (a) Mean acrylamide (ng g−1) for each month on the natural log (to base e) scale and number of observations (n). (b) Least significant difference (LSD) values on 1887 degrees of freedom at the 5% (p < .05) level of significance. The value for a particular comparison of the means is given by reading along the appropriate row and up the appropriate column
Table 7. Mean (ng g−1), standard error of mean (SE), number of values (n), mean of loge data, Q85, Q90, Q95, maximum value and proportion (%) of samples >750 ng g−1 for acrylamide by type and year in samples of potato crisps from Europe 2002 to 2019
Figure 4. Overall mean acrylamide levels (ng g−1) in samples of potato crisps of different types (standard, thick cut and ridge/wave) shown over years from 2002–2019, with standard errors
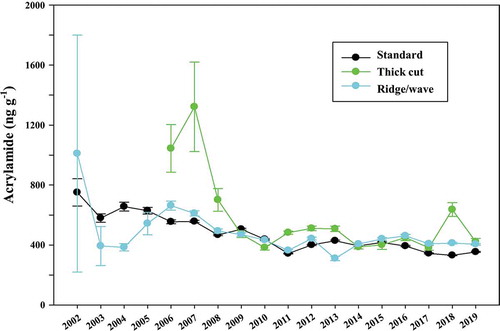
Table 8. Grouping of 25 European countries into geographic regions (north, south, east and west) that formed the basis of the regional analysis of acrylamide levels. Note that there were no observations from Estonia, Luxembourg, Malta or Slovenia in the dataset
Table 9. Mean (ng g−1), standard error of mean (SE), number of values (n), proportion (%) of samples with more than 750 ng g−1 and mean of loge data for acrylamide by region and year in samples of potato crisps from Europe, 2002 to 2019
Figure 5. Overall mean acrylamide levels (ng g−1) in samples of potato crisps in the ESA dataset from different regions of Europe (north, south, east and west; Table 9), shown over years from 2002–2019, with standard errors
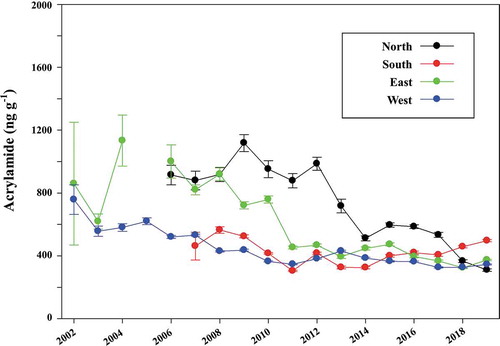
Figure 6. Proportion (%) of samples in the ESA dataset from different regions of Europe (north, south, east and west; Table 9) with more than 750 ng g−1 acrylamide over years from 2007 (the first year in which there was data from all four regions) to 2019
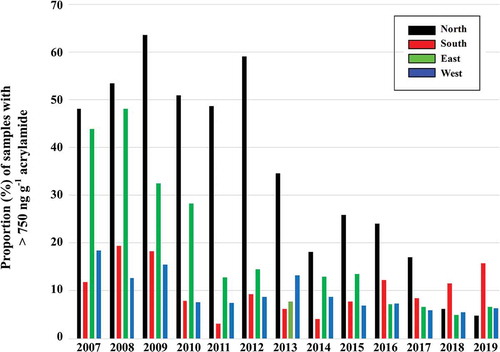
Table 10. Proportion (%) of samples of potato crisps with more than 750 ng g−1 acrylamide for each month for the period 2017 to 2019
Figure 7. Proportion (%) of samples in the ESA dataset with more than 750 ng g−1 acrylamide each month for geographic regions of Europe over periods. (a) 2017–2019. (b) 2011–2016 (Powers et al. Citation2017)
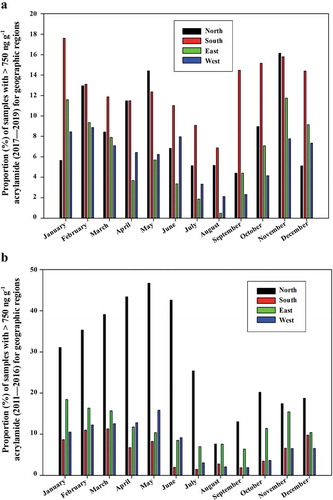
Figure 8. Correlation between yearly means for ESA and EFSA data (r = 0.458, n = 8, p = .254, F-test). The pairs of means are plotted with standard errors and labelled by year