Figures & data
Figure 1. Fraud related irregularities detected in 50 European labelled wine samples from the Chinese market. (a): Distribution of suspect samples based on label, bottle, cork and capsule inspection and based on chemical analysis of the wines. (b): Venn diagram of types of fraud distribution based on analysis results. Depicted frauds include chaptalisation, watering, use of a non-Vitis vinifera anthocyanin source and the addition of technical glycerol. Criteria for the allocation of the samples to the respective fraud categories are given in the text. 39 samples were unsuspicious based on the performed analytical tests. Samples with irregular visuals are marked as dark red dots
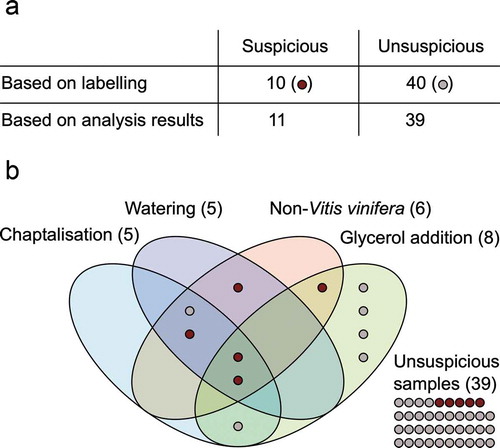
Table 1. δ13C analysis comparison of Chinese standard method QB/T 5164–2017 and OIV method OIV-MA-AS312-06
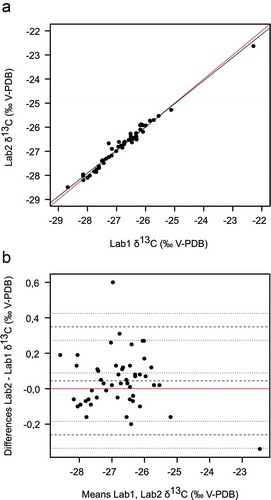
Figure 2. Comparison of two methods for δ13C determination in wine ethanol. Lab1 applied OIV-MA-E-AS312-06 and Lab2 the Chinese standard QBT 5164-2017. (a): Scatter plot of the results of Lab1 plotted against Lab2. Red line: Bisector. Black line: Linear regression. Linear regression equation: Lab2 = 0.9610 × Lab1 - 0.9996, n = 50. (b): Bland-Altman comparison. The zero line at Lab2 - Lab1 = 0 is marked in red. Dotted lines indicate the ULoA, bias and LLoA while the fine dotted lines mark their respective confidence intervals (95%). Number of comparisons: 50. Abbreviations are explained in the text