Figures & data
Table 1. Selected analytical approaches for the analysis of EO and/or 2-CE in foodstuffs
Figure 1. GC-MS/MS chromatogram of 2-CE in an ice cream sample containing 0.017 mg/kg of EO (2-CE = 0.032 mg/kg) and its internal standard fortified at 0.020 mg/kg 2-CE
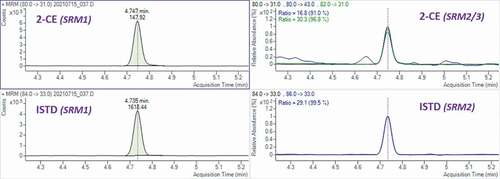
Table 2. Performance of the GC-MS/MS method for the quantitative determination of 2-CE in ice cream by isotope dilution
Figure 2. GC-HRMS chromatograms of a chemical standard of 2-CE (top) and an ice cream extract contaminated with 2-CE (bottom). Two chlorine atom-derived fragment ions at m/z 78.9945 (from 35Cl) and m/z 80.9916 (from 37Cl) are shown as well as the ion at m/z 31.0178
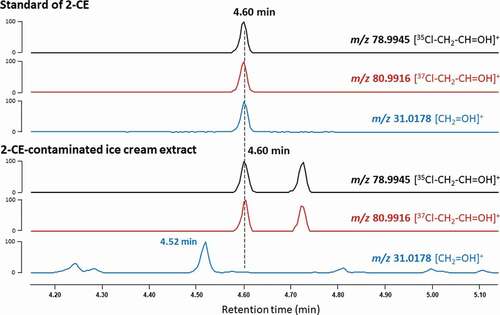
Figure 3. Correlation of EO levels measured by two independent laboratories (n = 23). Note, some data points (n = 7) are superimposed at the origin (below LoQ)
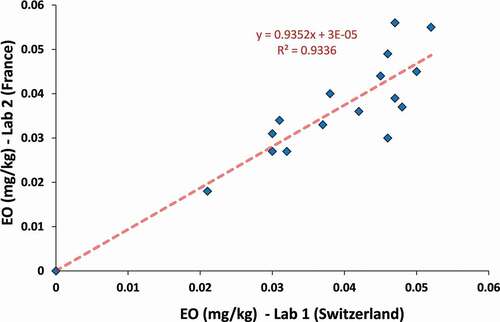
Figure 4. Fate of EO and 2-CE under different thermal conditions. Ice cream was fortified at 0.5 mg/kg EO or 1 mg/kg 2-CE before heat treatment and analysis. Results are expressed in EO equivalent (n = 3 independent determinations)
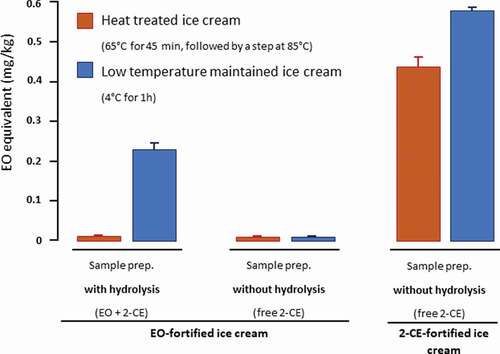
Figure 5. EO levels determined with or without conversion of EO to 2-CE during extraction in n = 32 ice cream samples. Levels are expressed in EO equivalent
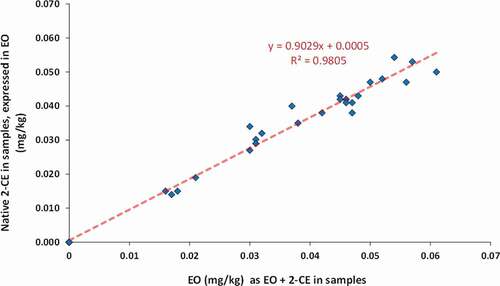
Figure 6. Possible chemical and biological pathways to EO and 2-CE from ethylene