
Figures & data
Table 1. Sweetness equivalence of six LNCS
Table 2. Brazilian 2017 tonnage data of LNCS per food group (Euromonitor International Citation2021)
Figure 1. Example calculation for the ‘per food’ replacement model for sucralose.
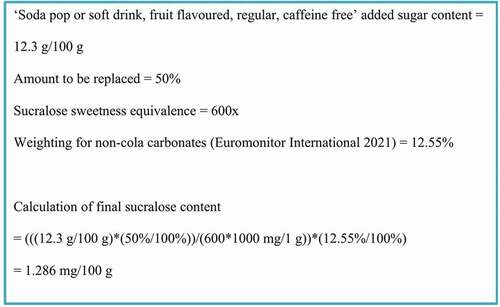
Table 3. Estimated daily intake of added sugar in Brazil by population group (2008–2009 POF data)
Table 4. Estimated daily intake of acesulfame-K following replacement of added sugar on a per person or per food basis in Brazil by population group (2008–2009 POF data)
Table 5. Estimated daily intake of aspartame following replacement of added sugar on a per person or per food basis in Brazil by population group (2008–2009 POF data)
Table 6. Estimated daily intake of cyclamate following replacement of added sugar on a per person or per food basis in Brazil by population group (2008–2009 POF data)
Table 7. Estimated daily intake of saccharin following replacement of added sugar on a per person or per food basis in Brazil by population group (2008–2009 POF data)
Table 8. Estimated daily intake of steviol glycosides following replacement of added sugar on a per person or per food basis in Brazil by population group (2008–2009 POF data)
Table 9. Estimated daily intake of sucralose following replacement of added sugar on a per person or per food basis in Brazil by population group (2008–2009 POF data)
Table 10. Qualitative evaluation of the influence of uncertainties on the estimates of exposure to LNCS calculated for Brazilian populationa