Figures & data
Table 1. Feed additives used in this study and information, the name and composition of these products containing the active substance as target and the unique identification number as specified in the corresponding legal acts available via the EU Register of Feed Additives (European Union Citation2021a), qs: quantum satis. In addition, the chemical formula, the accurate masses of the active substances measured with the DART-HRMS system on the feed additives, the ion assignments and the mass errors are shown. The legal act contains a reference to a feed additive specific EFSA opinion, which gives a full characterisation of the active substance
Figure 1. Isotope pattern of diclazuril based on nominal masses: Comparison of the average of the measured relative intensities (n = 180, plotted on logarithmic scale) with the corresponding calculated values. The standard deviation of the relative intensities are shown as error bars.
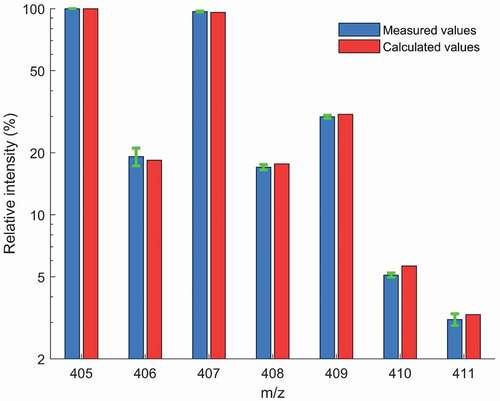
Figure 2. Mass spectra of polar solvent extracts from Coxiril measured in: (a) positive DART-MS mode and (b) negative DART-MS mode.
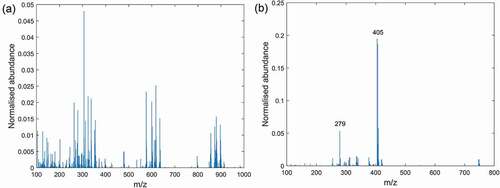
Figure 3. Mass spectra of extracts from Clinacox 0.5% measured in negative DART-MS mode: (a) extraction with the polar solvent and (b) extraction with n-hexane.
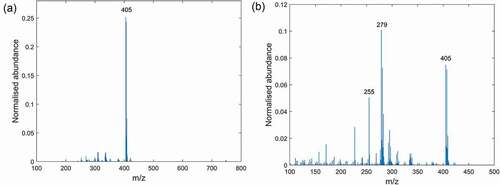
Figure 4. Between batch variation of each product expressed in terms of the scores of the first and the second principal component. Three batches with two sachets, where the letters A to C stand for the batch and the number 1 and 2 stand for the sachets: (a) Coxiril, polar solvent extracts measured in negative DART-MS mode and (b) Clinacox 0.5%, n-hexane extracts measured in positive DART-MS mode.
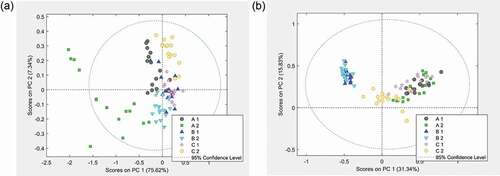
Figure 5. Variation between products: PCA score plots from the measurements of the polar solvent extracts. (a) Measurements in negative MS mode and (b) measurements in positive MS mode. Coxiril ‘1ʹ and Clinacox 0.5% ‘1ʹ are the samples to create the PCA model, while the Coxiril ‘2ʹ and Clinacox 0.5% ‘2ʹ samples are used for prediction purposes.
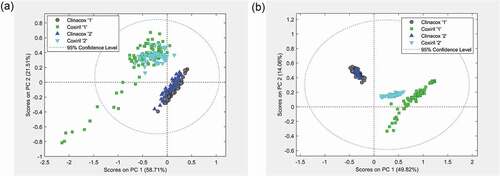
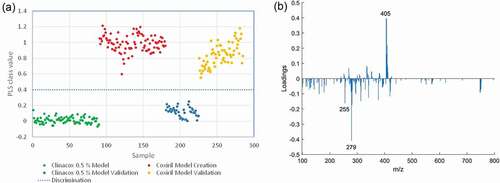
Figure 6. Classification of Coxiril and Clinacox 0.5 % samples: Presentation of the PLS-DA model obtained on the polar solvent extracts measured in negative MS mode: (a) response values of the model and prediction samples and the threshold. (b) Loading plot form the first latent variable.