
Figures & data
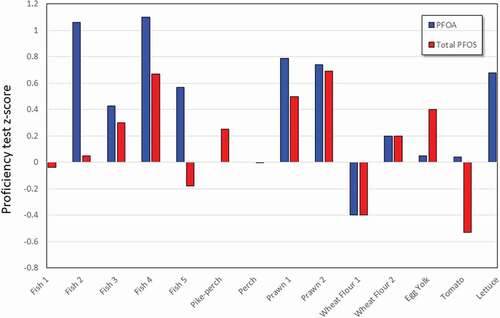
Figure 1. Chromatograms of individual PFASs, note Br-PFOS and L-PFOS appear in the same trace. A and B – carboxylic acids and sulfonate traces, while C shows PAP traces.
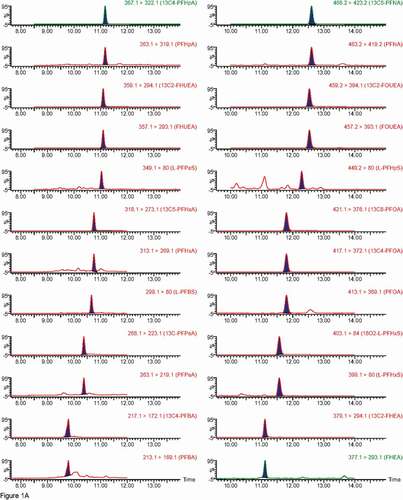
Figure 1. (Continued).
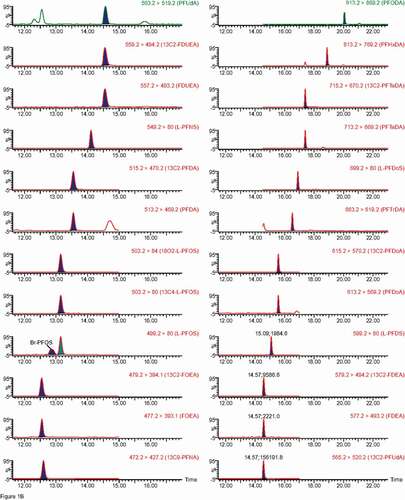
Figure 1. (Continued).
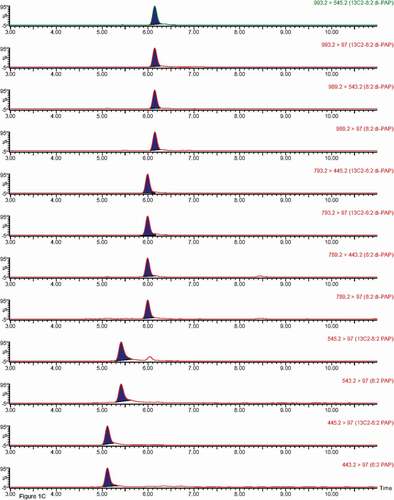
Table 1. Analyte information including transitions monitored, surrogate standard selection and linearity of response established using LC-MS/MS
Table 2. List of surrogates and performance standards
Figure 2. Proficiency test z-scores for PFASs in fish and prawns; note PFOA and ΣPFOS data provided in graphical abstract.
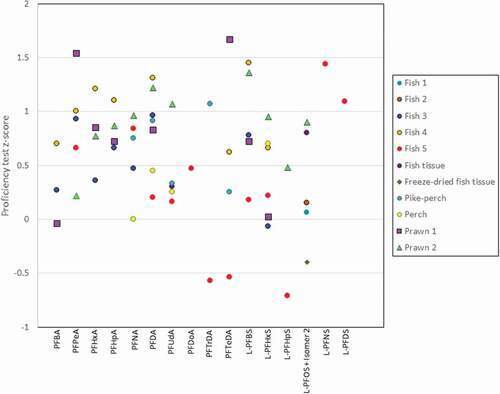
Figure 3. Proficiency test z-scores for PFASs in proficiency test materials; note PFOA and ΣPFOS data provided in graphical abstract.
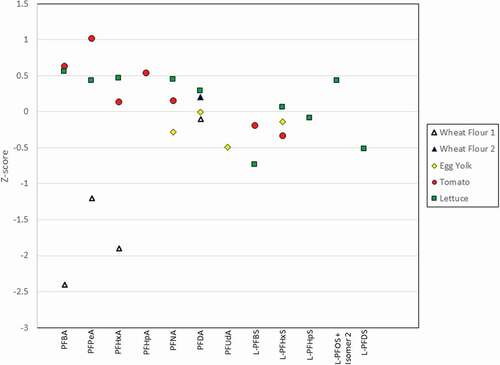
Table 3. Instrumental limits of detection (LOD) and limits of quantification (LOQ) determined for method analytes
Table 4. Summary of recovery information for analytes in canned fish samples
Table 5. Summary of recovery information for analytes in pizza
Table 6. Summary of recovery information for analytes in chicken nuggets
Table 7. Summary of recovery information for analytes in spinach