Figures & data
Table 1. Prevalence of adulterated herbal products with active pharmacological ingredients.
Table 2. LC–MS/MS-based levels of individual compound(s) in supplements, their total concentrations, recommended daily doses and EDIs.
Table 3. Comparison between estimated concentrations in the PDE-Glo assay and the LC–MS/MS analysis. Only supplements classified as resulting in medium or high intake based on the bioassay are shown.
Figure 1. UPLC chromatogram of S13 extract and the various fractions collected.
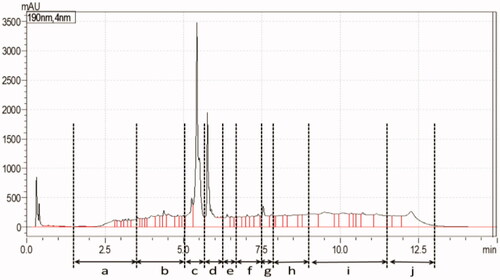
Figure 2. Inhibition potentials of collected fractions of S13 tested in the PDE-Glo bioassay, fraction c showing the presence of a PDE-5i.
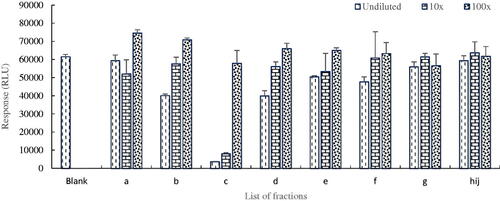
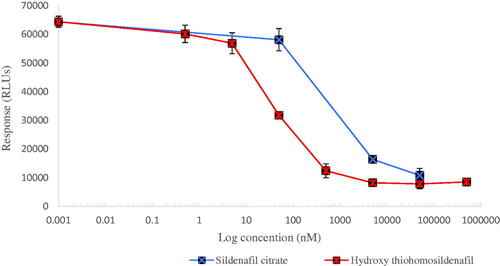
Figure 3. Concentration-dependent reduction in PDE-5 activity. IC50 values of 900 nM and 80 nM were calculated from the fitted dose–response curves for sildenafil and hydroxythiohomosildenafil, respectively, resulting in a REP value for hydroxythiohomosildenafil of about 12.