
Figures & data
Table 1. Food categories analysed for 3-MCPDE occurrence.
Table 2. Preparation of standard solutions.
Table 3. 3-MCPDE occurrence levels in Malaysian food items (by categories).
Figure 1. 3-MCPDE occurrence level per food category (mg/kg). Box plots represent the median, interquartile range, minimum and maximum levels in selected food categories. FF: Fast food; CFT: Confectionary; CBS: Cooked (boiled/stewed); MM: Milk and milk products; SN: Snacks; CF: Cooked (fried); KM: Kuih-muih; FO: Fats and oils Ο Outlier values: more than 1.5 × IQR (Boiled/stewed food: Beef curry; Snacks: Murukku; Cooked fried food: Fried anchovies) * Extreme outlier value for evaporated milk: 0.09 ± 0.091 mg/kg.
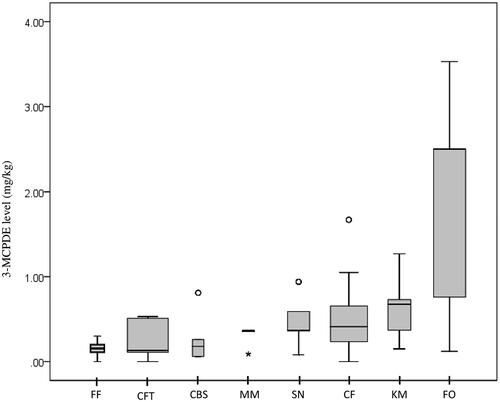
Table 4. Sociodemographic distribution of study subjects.
Table 5. Measure of association for risk factors of renal cancer.
Figure 2. Graphic representation comparing the mean estimated daily intake (mg/day) of 3-MCPDE according to (A) group (case/control) and (B) ethnicity with 95% CI (T-Bar).
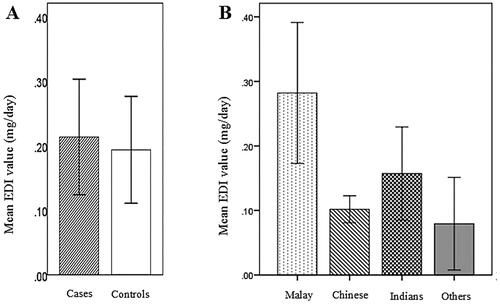
Table 6. Comparison of total EDI and individual EDI of 3-MCPDE (case and control group).
Table 7. Comparison of EDI (mg/day/person) of 3-MCPDE between groups considering ethnicity and gender.
Appendix 1. Variable definitions.