
Figures & data
Table 1. HPLC gradient elution program.
Table 2. Mass spectrometry acquisition settings.
Figure 1. Extracted ion chromatograms of (a) urea (m/z 61 > 44) in test material C containing 258.9 mg kg−1 of urea and (b) internal standard 13C15N2 urea (m/z 64 > 46) at a mass fraction of 526 mg kg−1.
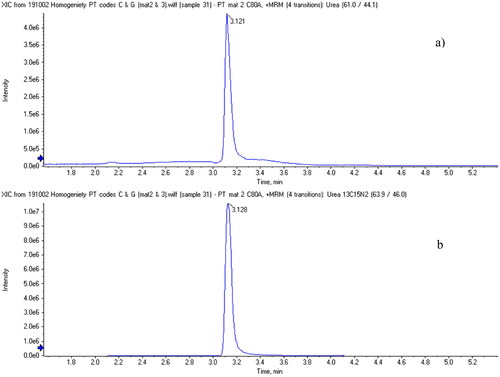
Table 3. Reference values of urea and moisture contents of the test materials accompanied by the respective uncertainty values (k = 2).
Table 4. Results (mg kg−1) of urea in the test materials J, C and G, as submitted by the interlaboratory study participants.
Figure 2. Distribution of the results submitted by the PT participants for the test materials J, C and G organized by analytical technique. Note: The horizontal line represents the reference mass fraction of urea in each test material. The uncertainties of the reference values are indicated in .
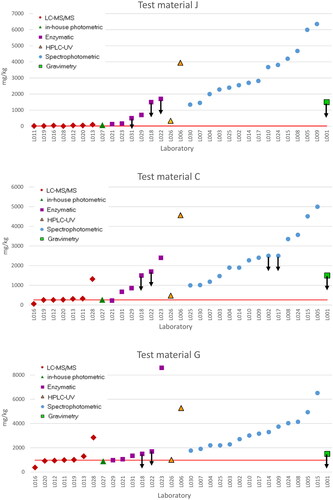
Table 5. Statistical parameters of the interlaboratory test: robust mean (ISO 5725-5) and reproducibility (RSDR).
Table 6. Performance parameters of the methods used by the participants.