
Figures & data
Figure 1. Inventoried animal farms and slaughterhouses pressures on the water sampling points. Data kindly provided by Regione Emilia Romagna Veterinary Office.
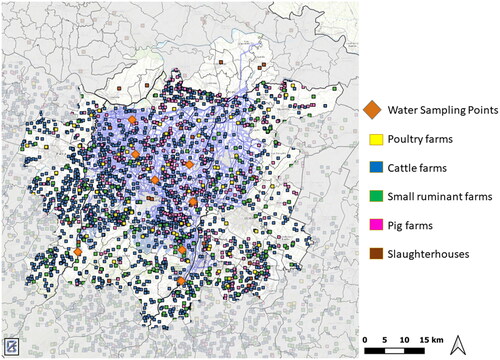
Table 1. Applied extraction and clean-up protocols to irrigation water and top soil improvers samples.
Table 2. Determined antimicrobials (ng g-1 wet weight) in top soil improvers, according to the different origin.
Table 3. Determined antimicrobials (ng L−1) in the 11 samples of irrigation water, according to the different origin.
Figure 2. ‘Extracted ion chromatograms referred to the analysis of the fluoroquinolone ciprofloxacin in top soil improvers and irrigation waters’. From top to bottom: analytical standard, cWWTP biosolid sample (, sample No. 20), and irrigation water sample from river (, ID #1298).
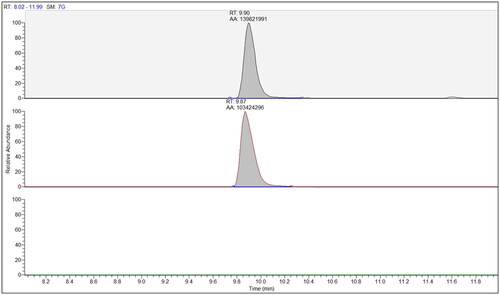
Table 4. Computed inputs (mg) and expected concentration (ng g−1) of antimicrobials from selected biosolids and irrigation waters in soils intended for lettuce production, according to the considered stancard agriculture practices.
Table 5. Hazard Index for antimicrobial resistance (HIAMR), accounting for worst case (wc) concentration (ppb) found in top soil improvers (TSI), irrigation water (IW) and for modelled inputs in soil.