Figures & data
Table 1. Overview of the quality control parameters.
Figure 1. Cannabinoid contents in mg kg−1 in the 30 investigated hemp seed oils. For each oil, the error bars represent the sum of the standard deviations for each individual cannabinoid from a duplicate workup, each measured at two dilution levels (n = 4). The individual values are listed in Table S3.
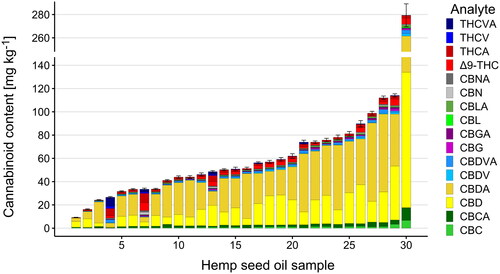
Figure 2. Percentage plot of cannabinoid profiles in each hemp seed oil sample.
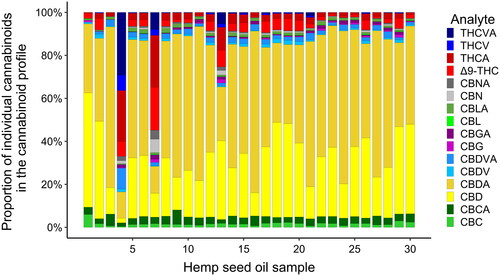
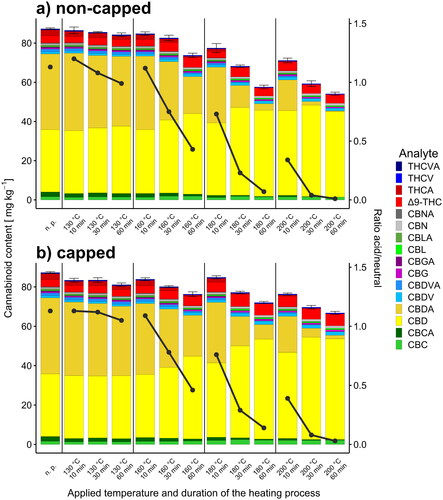
Figure 3. Sum of and individual cannabinoid contents in mg kg−1 in thermally processed hemp seed oils heated in vials that were a) non-capped and b) capped. The black dots represent the ratio of acidic and neutral cannabinoids (A/N) for the given samples (see secondary y-axis). For each sample, the error bars represent the sum of the standard deviations for each individual cannabinoid from a duplicate workup, each measured in two dilution levels (n = 4). The individual values are listed in Table S4 for a) and in Table S5 for b). ‘n. p.’ is short for ‘not processed’.