Figures & data
Table 1. Land use/accessibility elements on local and regional scales
Figure 1. Geographic location of Hashtgerd New Town in relation to other towns and cities. (a) Regional scale (Source: http://maps.google.com). (b) Middle scale: location of other towns around Hashtgerd New Town. FootnoteNotes.
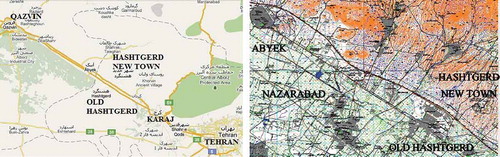
Figure 2. Middle scale: location of several villages around Hashtgerd New Town (PCE Citation2007).
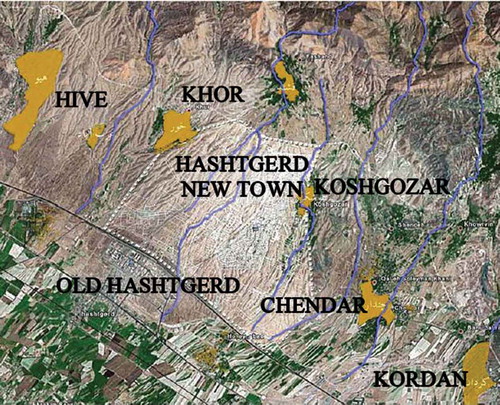
Figure 3. Small scale: different phases of Hashtgerd New Town. FootnoteNotes.
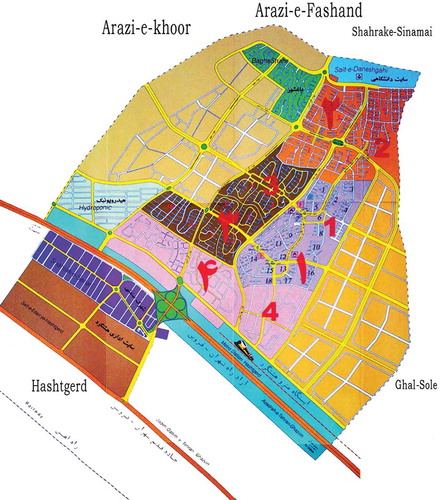
Figure 4. Hashtgerd New Town, phase 1. FootnoteNotes.
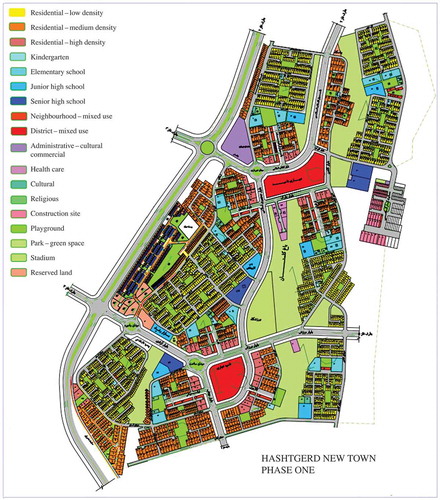
Figure 5. Hashtgerd New Town, phase 2. FootnoteNotes.
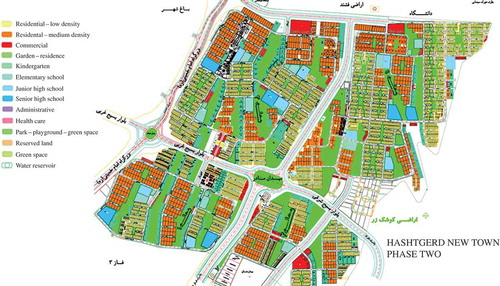
Figure 6. Hashtgerd New Town, phase 3. FootnoteNotes.
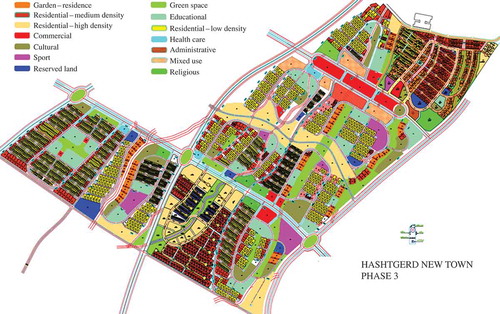
Figure 7. Education level.
Figure 8. Intensity of influence of Tehran on its hinterland (Rezaii and Vusat Citation2011). FootnoteNotes.
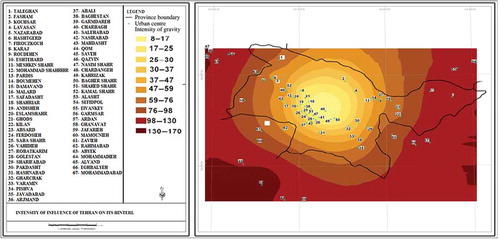
Table 2. Public transportation facilities in Hashtgerd New Town
Figure 9. Traffic intensity on the arteries connecting Tehran to its hinterland (TCTTS Citation2007).
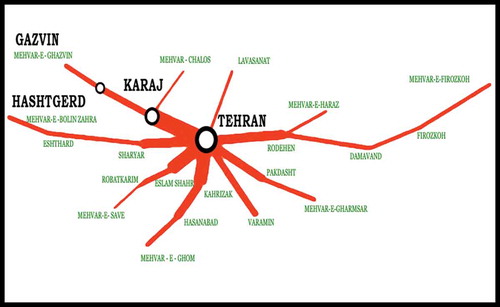
Figure 10. Hinterland of Tehran based on time intervals (Rezaii and Vusat Citation2011). FootnoteNotes.
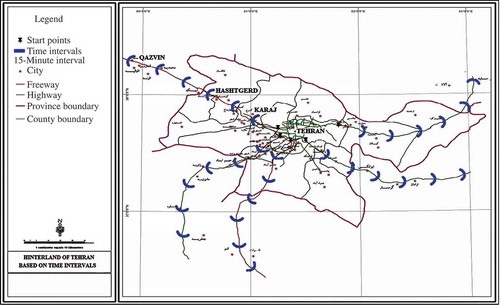
Table 3. Male workplace destinations
Table 4. Children's education places
Table 5. Daily shopping destinations
Table 6. Visits to/from relatives
Table 7. Leisure facilities
Table 8. Average number of weekly trips by family members to the main cities
Table 9. Vehicles used by each family member for daily trips
Figure 11. Relationship between different factors affecting travel demand.