
Figures & data
Table 1. Profile of participants in PB, 2000.
Table 2. OP demands per municipal department, 1990–2007.
Table 3. Porto Alegre: participatory budgeting district thematic priorities.
Table 4. Municipal budget distribution by sector, 1989–2000 (millions of Reais).
Table 5. Percentage of investment projects completed and Total Investment in the OP in Porto Alegre.
Table 6. Evolution of social and environmental indicators in Porto Alegre.
Table 7. Survey of public perception of OP in Porto Alegre by percentage of population, 2006.
Figure 1. Participants in the PB Process in Porto Alegre (ObservaPoA Citation2017).
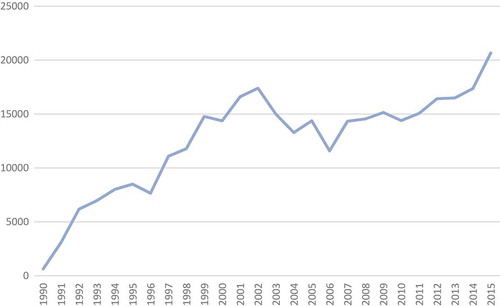
Figure 2. The Composition of the COP in Porto Alegre (2004Footnote8).
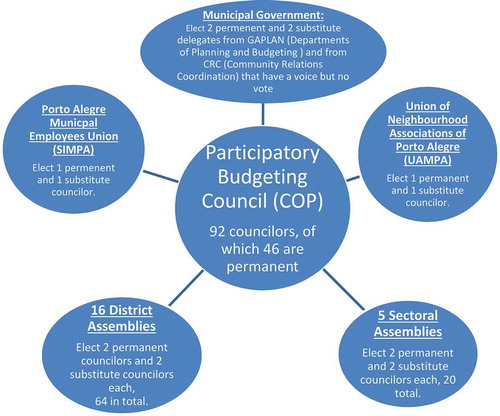
Table 8. Basic indicators of civil society organisations, Porto Alegre, 1988–2009.
Table 9. Principal institutional challenges and solutions to Porto Alegre’s participatory budgeting process.
Table 10. Evolution of socio-economic indicators in Porto Alegre 1991–2000.