Figures & data
Figure 1. A synopsis of transformations of urban informality in the Middle East
Figure 2. Urban Informality in three Middle Eastern cities
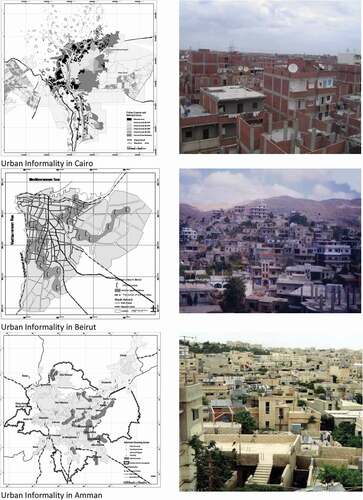
Figure 3. The correlation between sustainable transitions and urban informality Transitions
Figure 4. The multi-level perspective of sustainability transitions and its levels
Figure 5. Illustrates an example for formalization of urban informality as a PILaR. Top left shows El Rezqa area before the implementation of PILaR. Top right shows the urban pattern of El Rezqa site after the implementation of PILaR. Bottom demonstrates the current construction process of El Rezqa area according to the official approval of PILaR
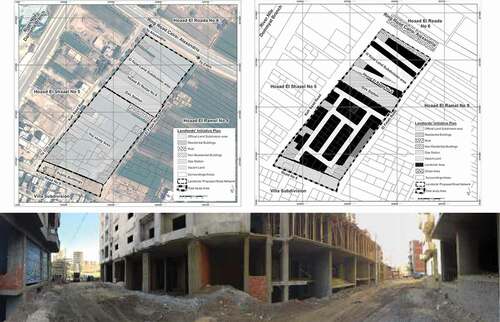
Figure 6. The linkage between sociotechnical systems, the MLP and the MP in urban informality
Figure 7. A linkage between four pathways on the urban informality transitions in cities