
Figures & data
Table 1. Examples of studies addressing the sustainability implications of biowaste valorisation.
Figure 1. Overview of the research design of the study.
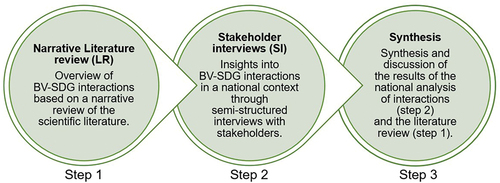
Figure 2. The scales used to identify BV-SDG interactions in the literature review and the stakeholder interviews.
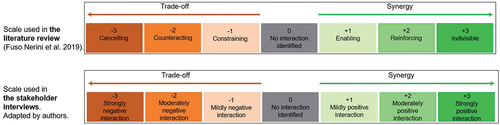
Figure 3. The selection of SDG targets addressed in this study.
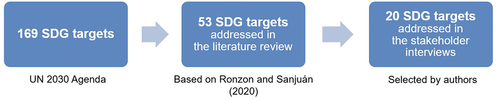
Figure 4. Classification of interviewees under different biowaste valorization dimensions (BV in the centre of the venn diagram). Each interview has been assigned a code where A: academia, I: industry, NGO: non-governmental organization, P: public authorities, followed by the number of the interview.
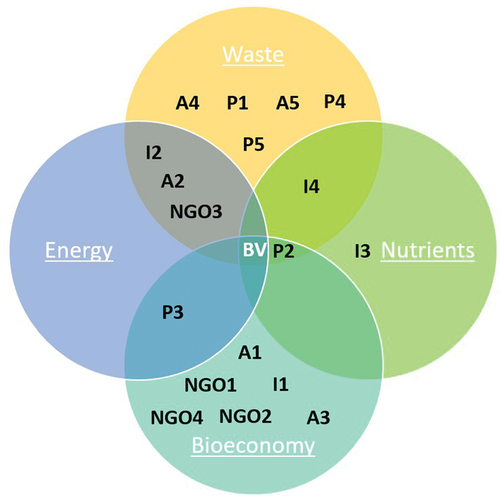
Figure 5. Synergies and trade-offs between biowaste valorization and the selected 53 SDG targets as identified through the literature review. The targets marked in dark grey indicate absence of identified evidence, not necessarily absence of interaction. Graphics adapted from Fuso Nerini et al. (Citation2019).
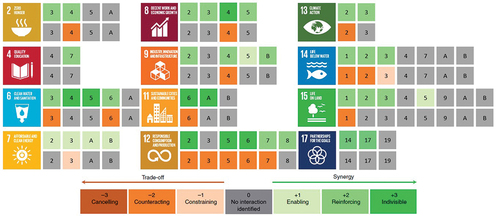
Table 2. Governance aspects of BV implementation influencing BV-SDG interactions.
Figure 6. BV-SDG interactions (median and extreme values) as identified through the stakeholder interviews. The size of the circles represents the number of interviewees who chose the equivalent score, while the colour of the circles corresponds to the likert scale of . The numbers around the diagram represent the equivalent SDG target.
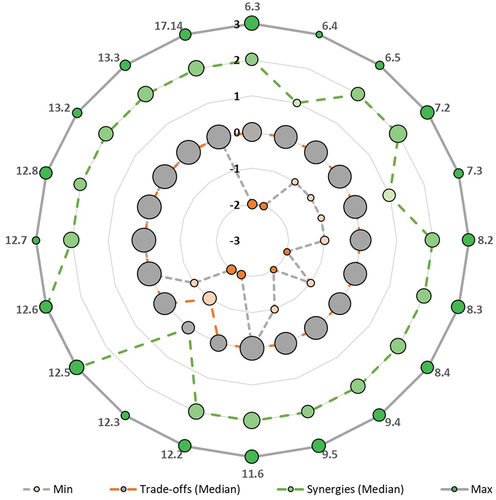
Table 3. Interactions between BV and SDG 12.3: interview findings and connection to the literature review.
Figure 7. Comparison of BV-SDG interactions as identified through the literature review and the stakeholder interviews. The synergies are shown in green and the trade-offs in orange. Scores from the literature review are represented with solid fill colours, while scores from the stakeholder interviews with strip patterns. The median values were used.
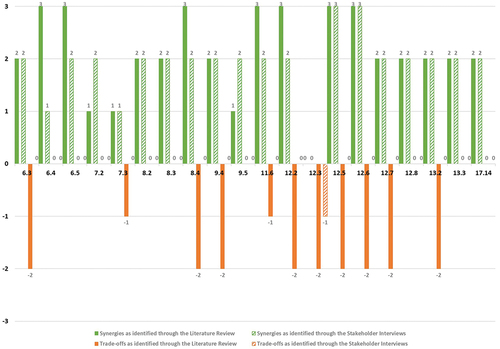
Table 4. Key study findings and their relevance to previous scientific research.