Figures & data
Figure 1. Illustration of electrical breakdown experimental setup.
Table 1. Details of prepared silicone elastomers.
Table 2. Properties of the prepared silicone elastomers. The thermogravimetric data is obtained in nitrogen atmosphere. The mechanical properties are measured at room temperature.
Scheme 1. The structure of chloropropyl-functional silicone elastomers (bottom) and the DMS-V31 reference elastomer (top).
Figure 2. Thermal gravimetrical analysis of chloropropyl-functional silicone elastomers. The analysis was performed in a nitrogen atmosphere with a heating rate of 10°C min−1 from room temperature to 900°C.
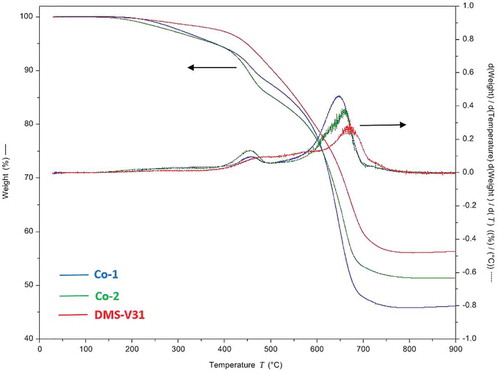
Figure 3. Illustration of common brittle failures after electrical breakdown for the reference DMS-V31. For all three breakdown zones there is a large extent of solidified matter around the pin-hole.
Figure 4. Scanning electron micrographs of breakdown zones for four reference samples (top images), four Co-1 silicone elastomers (middle images), and four Co-2 silicone elastomers (bottom images). The black areas correspond to areas where the elastomer was completely cleared away during breakdown, i.e. pinholes. The white areas are solidified material with high content of silicon. Not all scale bars are identical in order to show the most important features of the specific breakdown zones, which vary dimensionally from narrowest width of around 40 µm to largest width of around 400 µm. Ebreakdown(Reference Sample 1) = 78 V/µm, Ebreakdown(Reference Sample 2) = 81 V/µm, Ebreakdown(Reference Sample 3) = 83 V/µm, Ebreakdown(Reference Sample 4) = 86 V/µm, Ebreakdown(Co-1 Sample 1) = 71 V/µm, Ebreakdown(Co-1 Sample 2) = 74 V/µm, Ebreakdown(Co-1 Sample 3) = 77 V/µm, Ebreakdown(Co-1 Sample 4) = 75 V/µm, Ebreakdown(Co-2 Sample 1) = 95 V/µm, Ebreakdown(Co-2 Sample 2) = 97 V/µm, Ebreakdown(Co-2 Sample 3) = 92 V/µm, and Ebreakdown(Co-2 Sample 4) = 93 V/µm.
Figure 5. Illustration of the boiling nature of the Co-1 elastomer upon electrical breakdown in different magnifications. Droplets of condensed degradation products are formed on the surface of the breakdown zone. Very little solidification is observed upon the introduced electrical breakdown in this elastomer, and most importantly, there is no solidified thread formation.
Figure 6. EDS mapping of the breakdown zones for the Co-1 elastomer. The material in vicinity of the pin-hole contains excess of chlorine (blue color), which support the hypothesis that silicon-containing substances have evaporated. Aluminum traces arise from the aluminum stub underneath the pinholes, onto which the elastomer is mounted for the electron microscopy. EDS color legend: Blue: Chlorine, Green: Silicon and Oxygen, Pink: Carbon and Red: Aluminum.
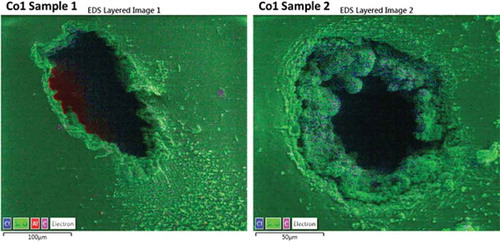
Figure 7. Breakdown zone analysis of Co-1 and Co-2 silicone elastomers for four different samples as shown in . The breakdown area is determined from a top view rather than a scan through the elastomer thickness as done for the pinhole volume determination.
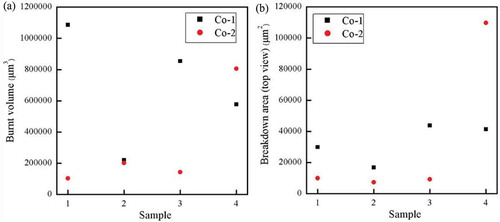
Figure 8. Tilted view of reference sample and Co-1. Scans through the thickness of the film are used to determine the volume of the pinhole.