Figures & data
Figure 1. Overview of published CNT paper measurements conducted in an in-plane set-up [Citation8,Citation13–Citation16,Citation18].
![Figure 1. Overview of published CNT paper measurements conducted in an in-plane set-up [Citation8,Citation13–Citation16,Citation18].](/cms/asset/57b4f5bd-a2c9-4e96-9c36-08d5097ab1d4/tsnm_a_1457573_f0001_c.jpg)
Table 1. Overview of experimental details of the tests presented in . All used electrolytes are tested as one molar (1 M) concentration. The suspension of tests marked with an asterisk () are homogenized (reduced amount of agglomerates) by centrifugation.
Table 2. Effective and hydrated ion radii according to [Citation42].
Figure 2. In-plane test set-up: a) Realized set-up b) Simulated set-up.
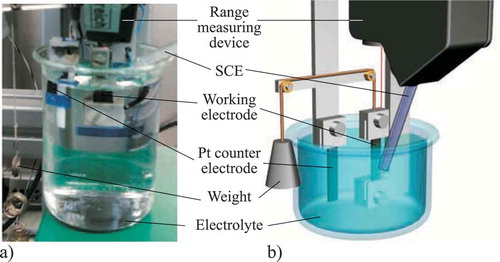
Figure 3. Set-up of the actuated tensile test: a) Overview of the whole realized PTFE-based set-up b) Detailed view of the three-electrode cell.
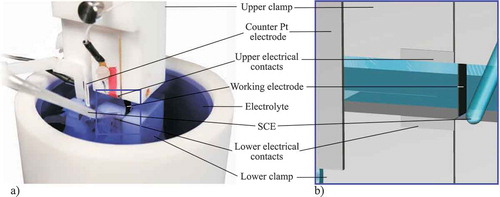
Figure 4. SEM pictures of an analyzed CNT paper: (a) Cross-section view of a broken CNT paper revealing a layer-like morphology (b) Detailed view of the cross-section showing a larger number of small cracks and delaminations between different layers of the paper (c) High resolution view of the interlinking SWCNTs between the separated layers of the paper (d) Top view of the fold line of a broken CNT paper.
Figure 5. Results of the cyclic voltammetry experiments at a scan rate of 40 mV/s using a SCE: (a) Cyclic voltammetry of tests conducted on the same CNT paper with different electrolytes (b) Cyclic voltammetry of tests using different CNT papers for each electrolyte.
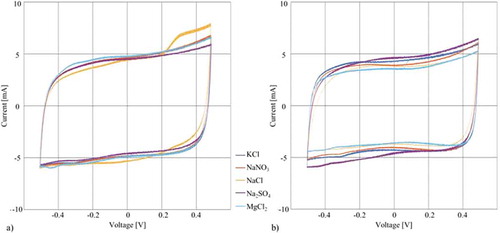
Table 3. Specific capacitances of different one molar electrolytes using the two sample approaches at 0.5 V and a scan rate of 40 mV/s (calculated using one CV cycle in constant state).
Figure 6. Free strain of different electrolytes using individual CNT paper cut from the same master CNT paper: (a) Results of the free strain measurements using the same negative ion Cl- (b) Results of the free strain measurements using the same positive Na+ ion.
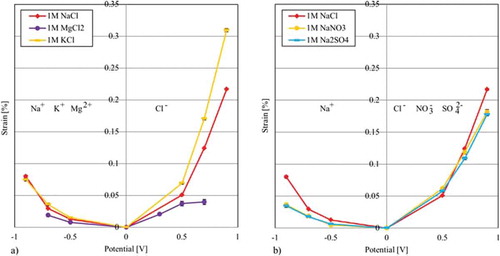
Figure 7. Free strain of different electrolytes using the same CNT paper: (a) Results of the free strain measurements using the same negative ion Cl (b) Results of the free strain measurements using the same positive Na
ion.
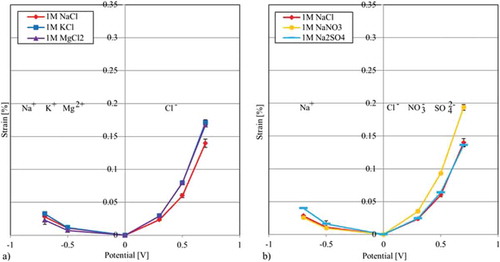
Figure 8. Correlations between crystalline/hydrated radii and generated strain of the two different approaches: (a) Correlation of the crystalline ion radii and strain using an individual paper for each electrolyte (b) Correlation of the crystalline ion radii and strain using one paper for all electrolytes (c) Correlation of the hydrated ion radii and generated strain using an individual paper for each electrolyte (d) Correlation of the hydrated ion radii and strain using one paper for all electrolytes.
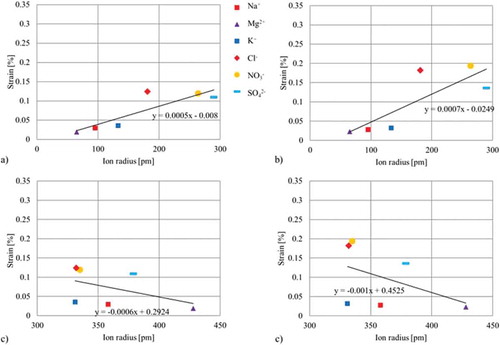
Table 4. Mechanical properties of the tested CNT papers under dry and wet conditions (all electrolytes with one molar concentration) and their specific electrical conductivity in dry state.
Figure 9. Different correlations of the elastic modulus: (a) Correlation between elastic modulus and measured electrical conductivity (b) Correlation between the elastic modulus and the free strain results at 0.7 V.
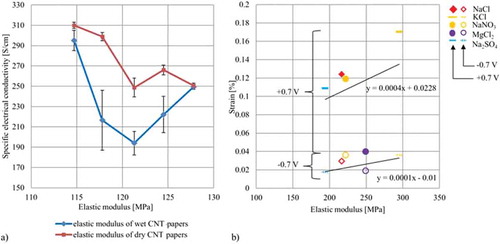
Table 5. Overview of results of the actuated tensile tests of CNT papers conducted with electrolytes of one molar concentration using a SCE.
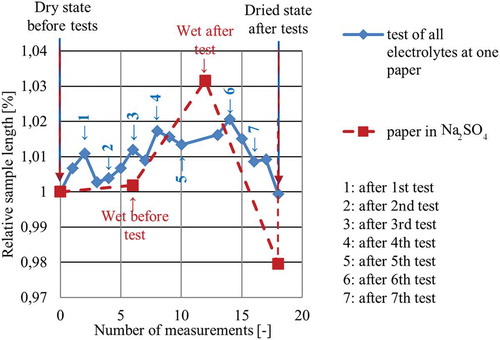
Figure 10. Overview of the results obtained from monitoring the geometry of three samples; monitoring took place during in-plane strain tests and revealed significant changes of geometry. The blue graph shows the change of the sample which was used for different electrolytes. The red graph reveals similar changes of the sample based on the measurement values taken at different sections, using one molar Na2SO4.