Figures & data
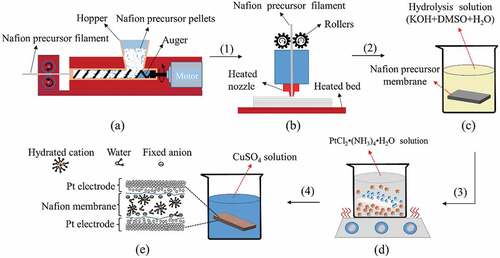
Figure 1. Schematic diagram of IPMC specimen fabrication by FDM technology: (a) Fabrication process of Nafion precursor filament. (b) Nafion precursor membrane printed by a 3D printer. (c) The hydrolysis process exchanges the sulfonyl fluoride group to a sulfonate end group. (d) Prepare Pt electrodes by an electroless plating process. (e) Ion exchange process
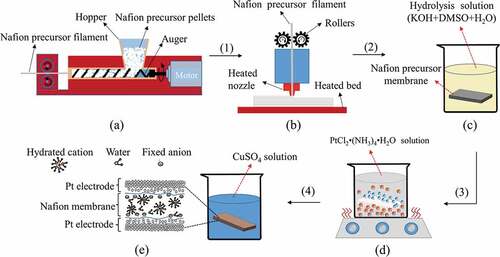
Figure 2. (a) The relationship between the thickness of precursor specimen and hydrolysis time; (b) the comparison of the IEC between the printed Nafion membrane and commercial membrane
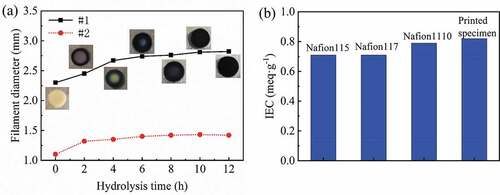
Figure 3. Thickness and mass of IPMC in air at room temperature vs. time
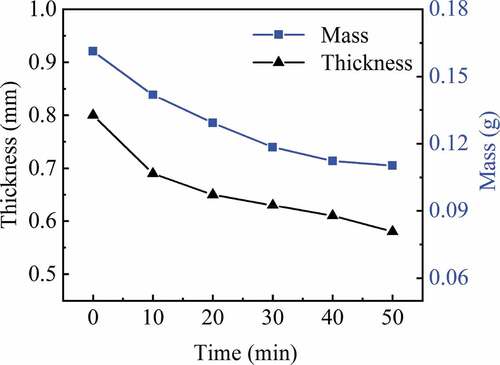
Figure 4. Currents vs. time under AC voltage with a frequency of 0.1 Hz. The actual current changes of the IPMC under square wave input (a) and sinusoidal input (b); the maximum currents of IPMCs under square wave input (c) and sinusoidal input (d)
Figure 5. Currents vs. time under AC voltage with a frequency of 0.1 Hz. The actual current changes of the IPMC under square wave input (a) and sinusoidal input (b); the maximum currents of IPMCs under square wave input (c) and sinusoidal input (d)
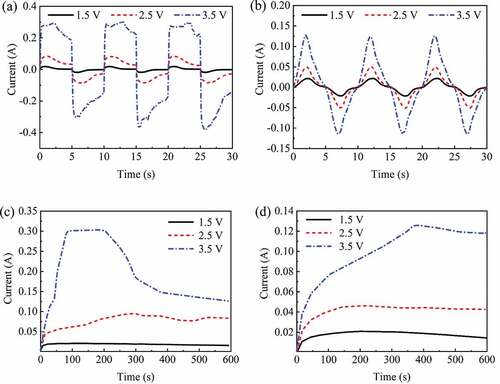
Figure 6. Displacement vs. time under AC voltage with a frequency of 0.1 Hz. The actual displacement changes of the IPMC under square wave input (a) and sinusoidal input (b); Maximum displacement of IPMC under square wave input (c) and sinusoidal input (d)
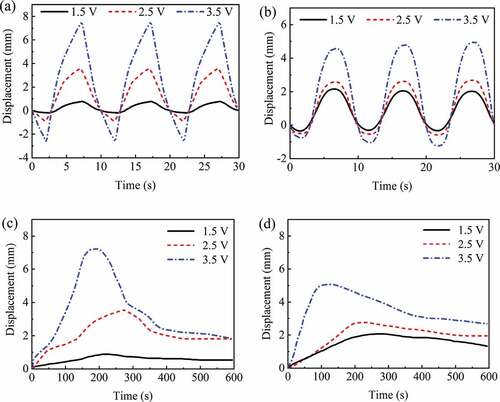
Figure 7. Blocking force vs. time under AC voltage with a frequency of 0.1 Hz. The actual blocking force changes of the IPMC under square wave input (a) and sinusoidal input (b); the maximum blocking force of IPMC under square wave input (c) and sinusoidal input (d)
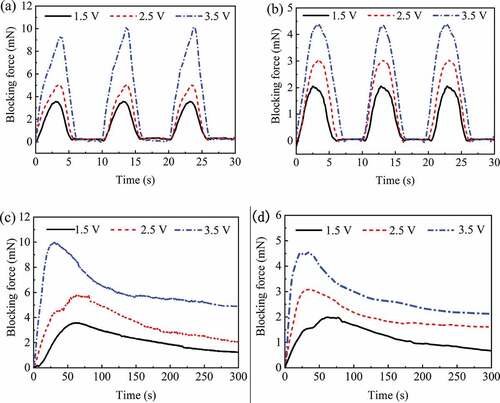
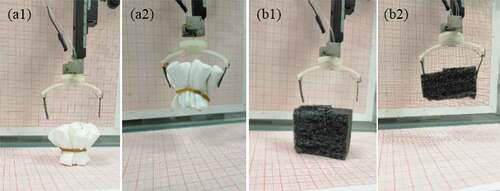
Figure 8. The flexible grippers made by two IPMCs: (a1, b1) the initial state of the gripper; (a2, b2) the state of grasping the object