Figures & data
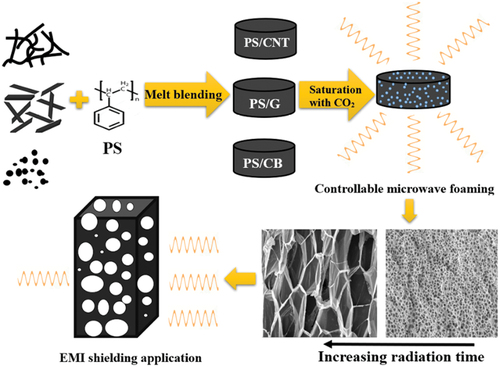
Figure 1. TEM micrographs of the composites in two different scales: a) PS/CNT1, b) PS/G1, and c) PS/CB1.
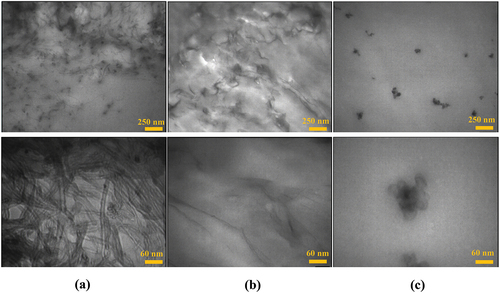
Figure 2. (a). Schematic of microwave-assisted foaming procedure, and (b) PS/G1 foamed samples in various radiation times, (c) schematic of the gas foaming procedure.
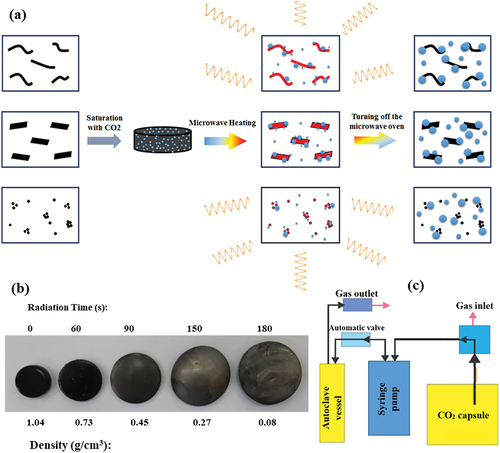
Table 1. Solubility of CO2 in produced nanocomposites.
Figure 3. The density of microwave-assisted foam composites containing various types of fillers as a function of radiation time.
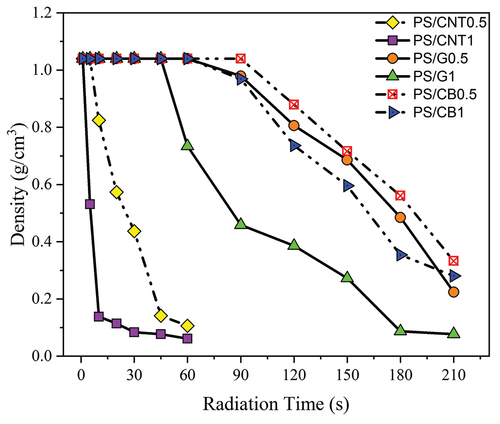
Figure 4. The density of microwave-assisted foams containing various types of fillers as a function of radiation power.
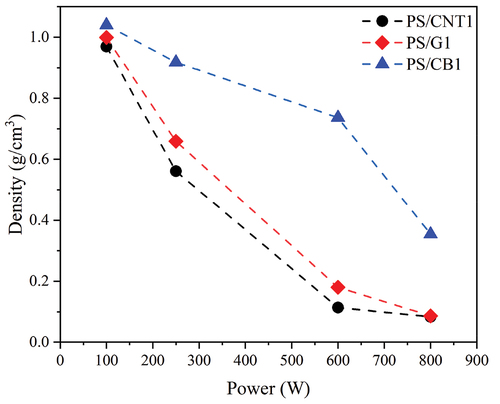
Figure 5. SEM micrographs and cell size distribution of microwave-assisted PS/CNT1 foams created at various radiation times.
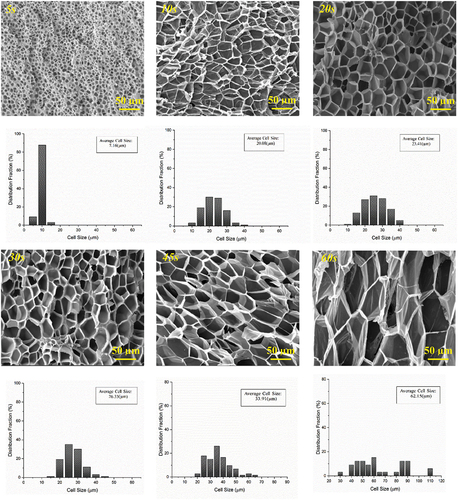
Figure 6. SEM micrographs and cell size distribution of microwave-assisted PS/G1 foams created at various radiation times.
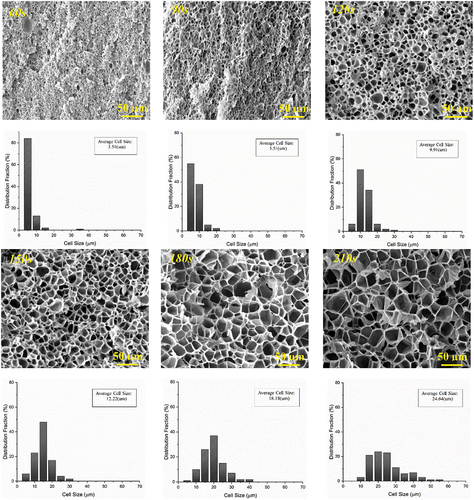
Figure 7. SEM micrographs and cell size distribution of microwave-assisted PS/CB1 foams created at various radiation times.
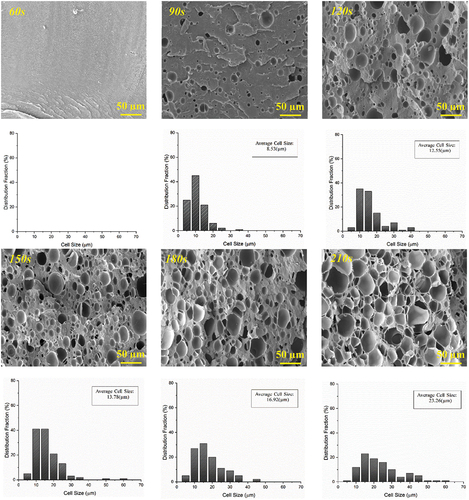
Table 2. Characteristics of the microwave-assisted foams.
Figure 8. (a) Electrical conductivity of the solid composites in different filler content. Electrical conductivity of (b) PS/CNT1, (b) PS/G1, and (c) PS/CB1 foams was produced in various radiation times as a function of cell size and final filler content.
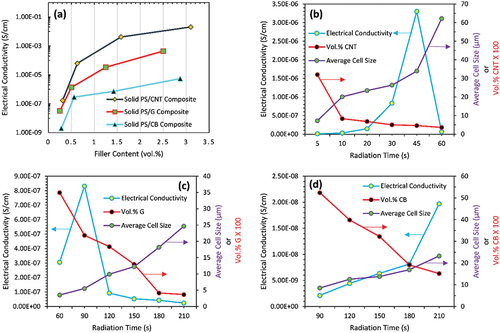
Table 3. Summary of electrical conductivity of the foam composites.
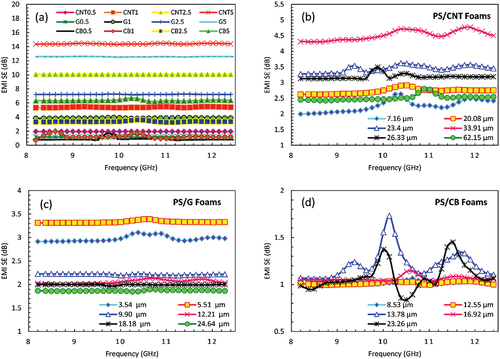
Figure 9. EMI SE of the solid composites (a), PS/CNT1 (b), PS/CNT1 (c), and PS/CNT1 (d), foams as a function of cell size at a different frequency.