Figures & data
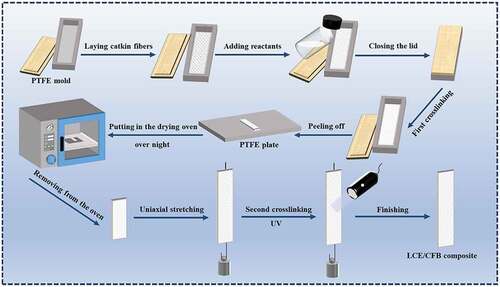
Scheme 1. Illustration of the experimental protocol for preparing the LCE/CFB composite.
Scheme 2. Illustration of the precursor reactant molecules and the synthesis of thiol-acrylate MC-LCE networks through TAMAP route.
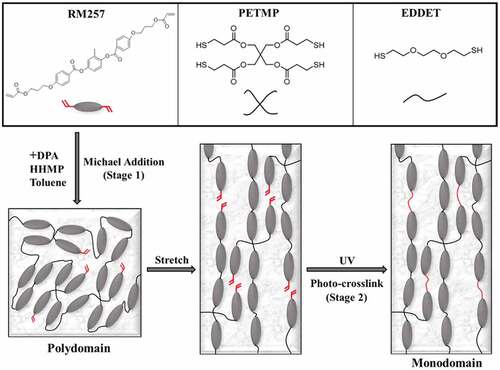
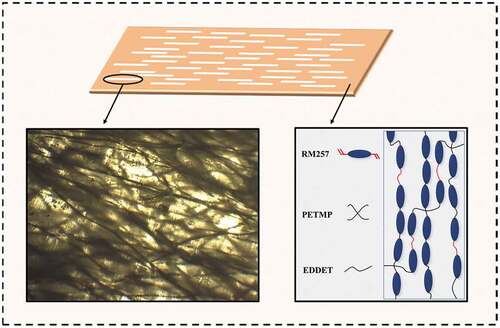
Figure 1. (a) A optical microscope image of the catkin fibers. (b) A SEM image of the cross section of the LCE/CFB composite. The embedded catkin fibers are pointed by the arrows.
Figure 2. (a, b) The POM images of blank thiol-acrylate MC-LCE (a) and LCE/CFB composite (b), inserted crossed pointers illustrate the polarization directions of the horizontal analyzer and vertical polarizer. (a-I, b-I) The polarizer is paralleled to the stretch directions. (a-II, b-II) The stretch directions are at −45° angle of inclination to the polarizer. (a-III, b-III) The analyzer is paralleled to the stretch directions. (a-IV, b-IV) The stretch directions are at −45° angle of inclination to the analyzer. (c, d) The 2D-WAXS patterns of the blank thiol-acrylate MC-LCE (c) and LCE/CFB composite (d), inserted arrows point the stretch directions.
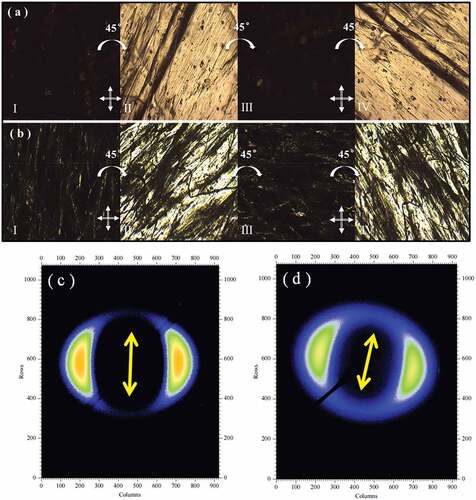
Figure 3. (a, b) DSC data curves upon heating and cooling scans of the blank thiol-acrylate MC-LCE (a) and LCE/CFB composite (b). (c, d) The Plots of the axial strain of blank thiol-acrylate MC-LCE (c) and LCE/CFB composite (d) versus temperature variation upon a cycle of heating and cooling, in isoforce (40 kPa) mode. (e, f) Microscope images of the LCE/CFB composite at 25°C (e) and at 90°C (f).
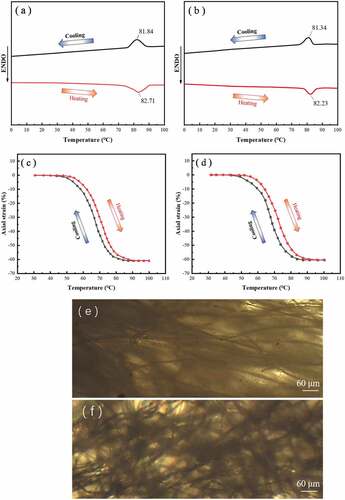
Figure 4. (a) The data curves of Young moduli versus temperature variation of the blank thiol-acrylate MC-LCE and LCE/CFB composite respective. (b) The data curves of apparent Young modulus versus temperature variation of the catkin fiber bundles. (c, d) The plots of the actuation stresses of the blank thiol-acrylate MC-LCE (c) and LCE/CFB composite (d) versus temperature variation upon a cycle of heating and cooling, in isostrain (0.1%) mode.
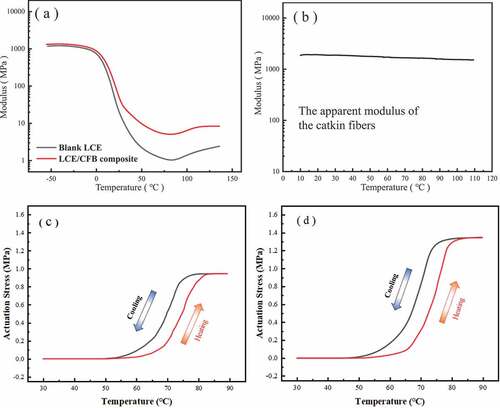
Figure 5. (a) The tensile strengths versus temperature of the blank thiol-acrylate MC-LCE and the LCE/CFB composite. (b, c, d) Optical micrograph images of the LCE/CFB composites which were tested by tension failure: (b) The arrow pointing part is the tiny crack in matrix whose expansion was restricted by the catkin fibers. (c) The arrow pointing parts are the tiny cracks in matrix whose expansion was hindered by the bridging effect of catkin fibers. (d) The fractured section shows the pulling out state of the catkin fibers. (e, f) The optical micrograph images of blank thiol-acrylate MC-LCEs which were tested by tension failure: The cracks in the middle (e) or side (f) of the matrix unrestrictedly expanded.
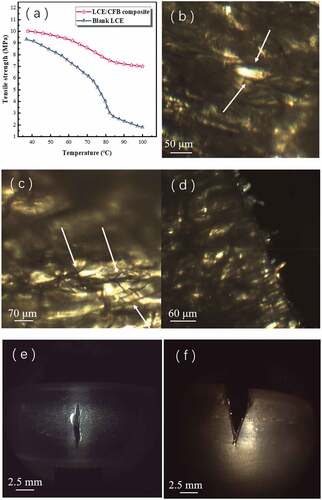
Figure 6. Upon repeated heating/cooling cycles and in isoforce mode, the axial strains versus time of the blank thiol-acrylate MC-LCE (a) and LCE/CFB composite (b) with different tension loads.
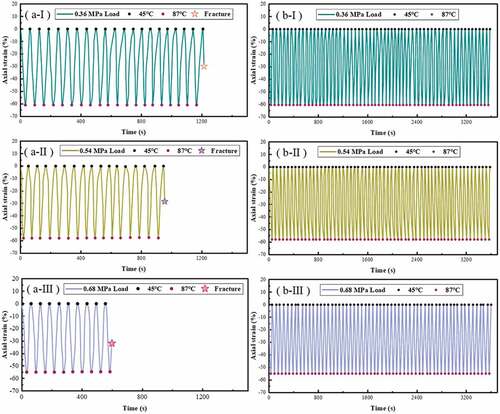
Figure 7. Upon repeated heating/cooling cycles and in isostrain mode, the actuation stresses versus time of the blank thiol-acrylate MC-LCE (a) and LCE/CFB composite (b) with different pre-elongated strains.
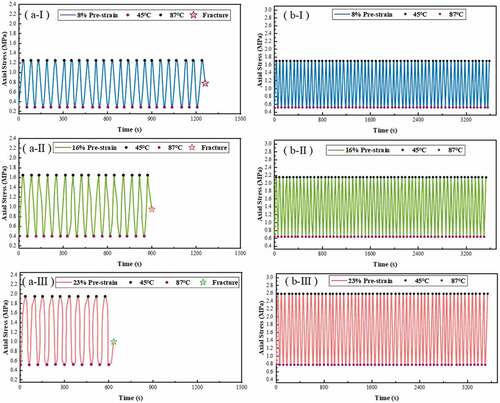
Figure 8. Upon repeated cycles of passively drawing/restoring, the axial strains versus time of the blank thiol-acrylate MC-LCE (a) and LCE/CFB composite (b) at different temperature.
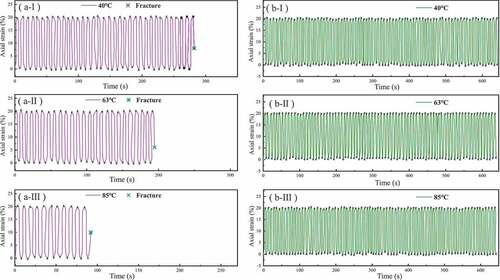
Figure 9. (a, b) The axial contraction strains and the achieved stable temperatures of the dye doped blank thiol-acrylate MC-LCE (a) and dye doped LCE/CFB composite (b) versus IR intensity, in isoforce (60 kPa) mode. (c, d) The actuation stresses and the achieved stable temperatures of the dye doped blank thiol-acrylate MC-LCE (c) and dye doped LCE/CFB composite (d) versus IR intensity, in isostrain (0.1%) mode.
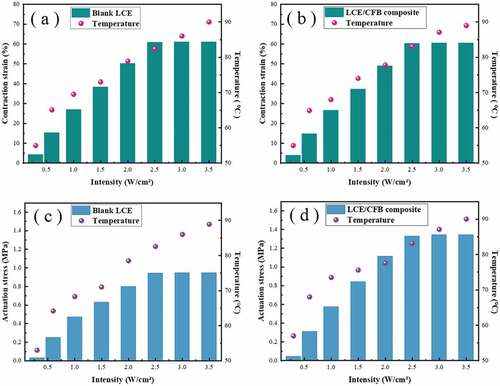
Figure 10. Upon repeated switching on/off cycles of IR with irradiation intensity of 3.5 W/cm2, and in isoforce mode, the axial strains versus time of dye doped blank thiol-acrylate MC-LCE (a) and dye doped LCE/CFB composite (b) with different tension loads.
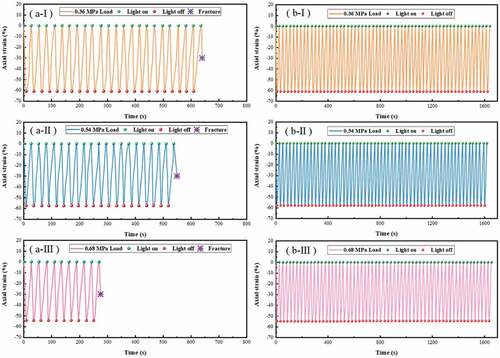
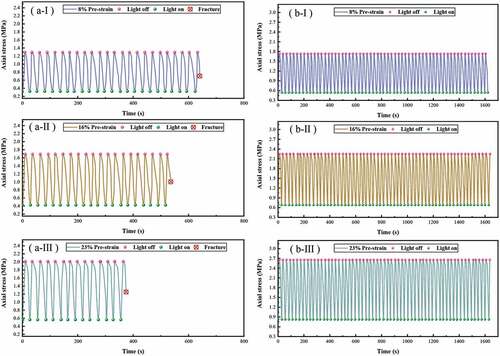
Figure 11. Upon repeated switching on/off cycles of IR with irradiation intensity of 3.5 W/cm2, and in in isostrain mode, the actuation stresses versus time of dye doped blank thiol-acrylate MC-LCE (a) and dye doped LCE/CFB composite (b) with different pre-elongated strains.