
Figures & data
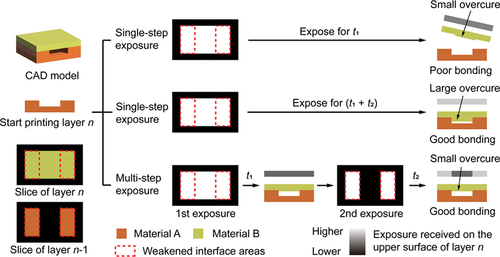
Figure 1. (a) Multi-material PSL process. (b) A two-step example of multi-step exposure method for multi-material PSL process.
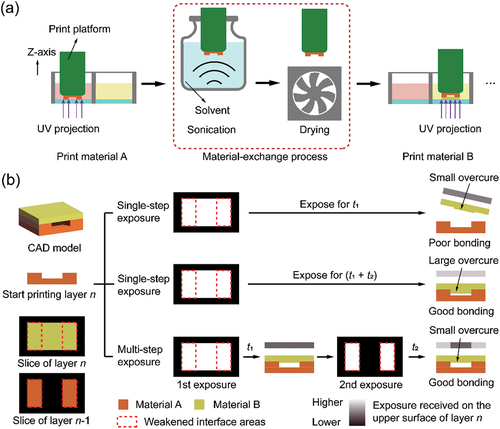
Figure 2. Flow chart of the multi-step exposure method.
Figure 3. Multi-step exposure in layer n. (a) Calculation of interfacial areas. (b) Multi-step exposure.
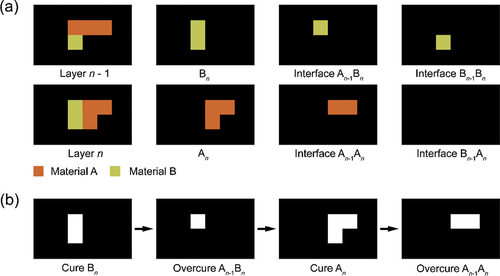
Figure 4. Working curve of TMPTA resin and PEGDA resin. N = 8. Error bars represent standard deviation.
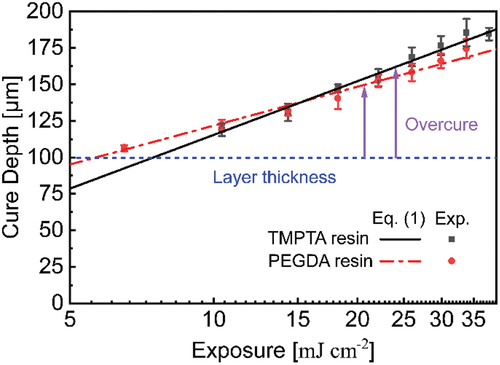
Table 1. Effect of total exposure time on cure depth and overcure on PEGDA and TMPTA resin.
Figure 5. A) Different types of tensile specimens. PE stands for PEGDA resin specimen, TM stands for TMPTA resin specimen, PT stands for specimen with PEGDA-TMPTA interface (PEGDA was printed first), TP stands for specimen with TMPTA-PEGDA interface (TMPTA was printed first), PP stands for specimen with weakened PEGDA-PEGDA interface (went through material-exchange process), TT stands for specimen with weakened TMPTA-TMPTA interface. b) Effect of interface exposure time on tensile strength of PT and TP specimens. c) effect of interface exposure time on tensile strength of PP specimens. d) effect of interface exposure time on tensile strength of TT specimens. For (a), (b), (c), and (d): N = 5. Error bars represent standard deviation.
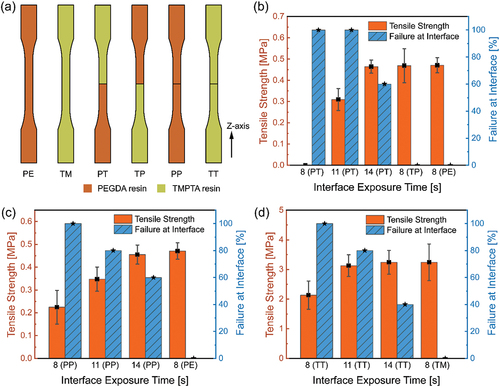
Table 2. Additional exposure time used for multi-step exposure.
Figure 6. Comparison of vertical accuracy between single-step exposure and multi-step exposure method. Scale bars represented 200 μm.
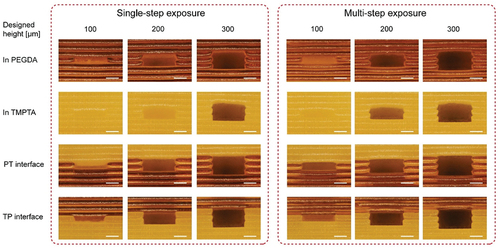
Table 3. Fabricated height and error of single-step and multi-step exposure method.
Figure 7. Comparison of lateral fabrication accuracy between single-step exposure and multi-step exposure method. a) microfluidic channels fabricated within TMPTA resin. b) microfluidic channels fabricated within PEGDA resin. Scale bars represented 200 μm.
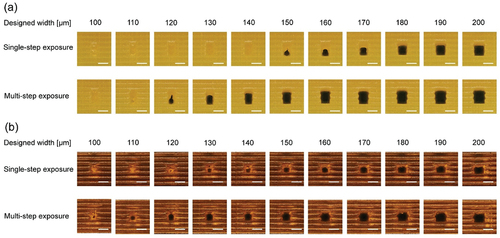
Table 4. Fabricated width and error of single-step and multi-step exposure method.