Figures & data
Table1. Sikkim earthquake of 18 September 2011 – foreshock, main shock and aftershock parameters given by different agencies.
Figure1. Tectonic map of the Sikkim Himalaya (after De & Kayal Citation2003) showing the epicentres of EHB relocated earthquakes (1965–2007). The 18 September 2011 main shock and four significant aftershocks (M ≥ 4.0) are shown by red stars. The foreshock of the earthquake is shown by filled black star. The open black stars show the two damaging strong earthquakes (M ≥ 5.9) with CMT fault-plane solutions. The solution of the 1988 earthquake is from Banghar (Citation1991) based on first motion plot, and the waveform inversion solutions of two smaller events of 2002 are from Baruah et al. (Citation2012a, Citation2012b). MCT: Main Central Thrust, MBT: Main Boundary Thrust, HFT: Himalayan Frontal Thrust, and GL: Goalpara lineament. The blue line indicates the river system. The black dotted line “AB” indicates the profile of MT stations used by Patro and Harinarayan (Citation2009) for their Magnetotelluric study. Inset: key map of the study area.
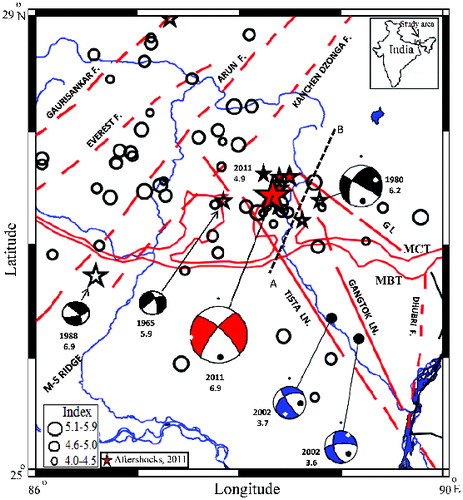
Figure2. A north-south cross section of the earthquakes across the 2011 main shock epicentre zone () showing the past earthquakes (circles) including two (1965 and 1980) strong earthquakes (open black stars), and the 2011 main shock (bigger red star), its four significant aftershocks (smaller red stars) and one foreshock (filled black star) occurred on a vertical fault zone at depth 10–50 km. TL: Tista lineament/fault.
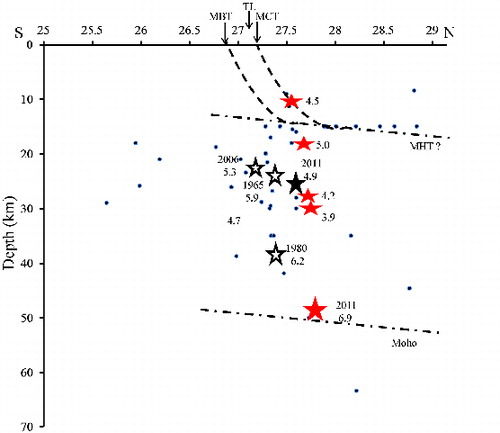
Table2. Results of stress tensor inversion using Michael and Gauss methods.
Figure3. Map shows all the 14 CMT fault-plane solutions available in the area and two waveform inversion solutions of smaller earthquakes of 2002 from Baruah et al. (Citation2012b). The years of occurrence and respective Mw are annotated. In the inset, the G and M indicate the stress inversion results by Gauss and Michael methods, respectively. Principal stress axes with their 95% confidence limits are plotted on lower hemisphere stereonets. The compression and tensional stress axes are indicated by arrows in G, and by 1 and 3 symbols in M, respectively. The intermediate axis is near vertical in both the solutions. The blue line indicates river system.
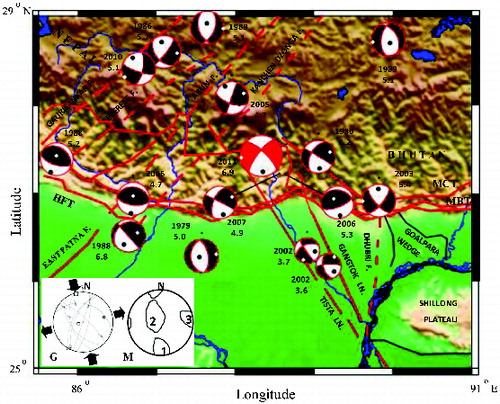
Figure4. Change in Coulomb static stress on optimally oriented strike-slip plane due to slip on the rupture of the 18 September 2011 earthquake Mw 6.9. The hot colours (red) indicate the increase in coulomb stress and the light colour (blue colours) indicate the decrease in stress.
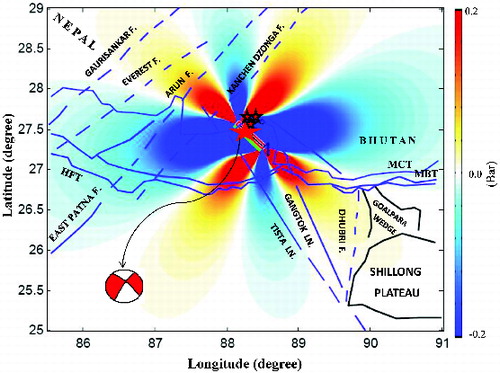
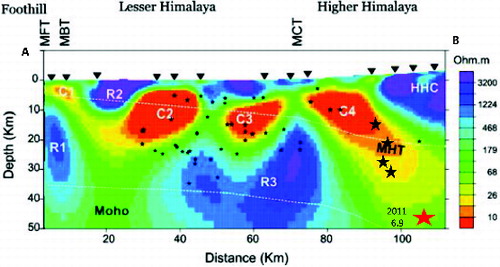
Figure5. Deep geoelectric structure obtained from two-dimensional inversion of magnetotelluric data (after Patro & Harinarayan Citation2009). The red star indicates the 18 September 2011 Sikkim earthquake and small black stars indicate the aftershocks which are plotted with respect to. the profile AB (see ).