Figures & data
Table 2. Per-pixel based normalized weights for each factor from the data-driven FR and expert-based AHP approaches.
Figure 1. Location of the Province of Salzburg within the elevation map of Austria.
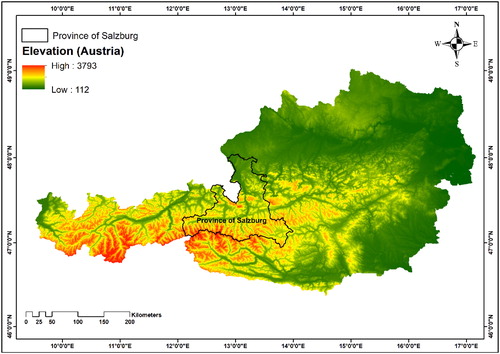
Figure 2. The GBA’s landslide inventory locations classified into training and validation data for the Province of Salzburg.
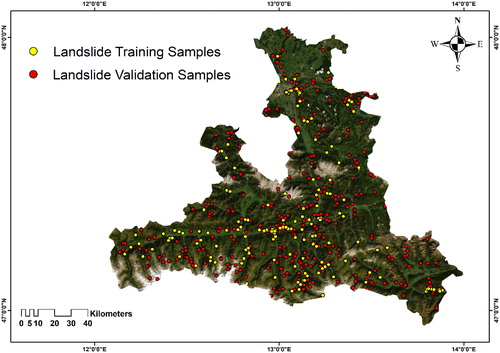
Figure 4. Landslide susceptibility maps derived using the per-pixel weighting approaches of FR and AHP.
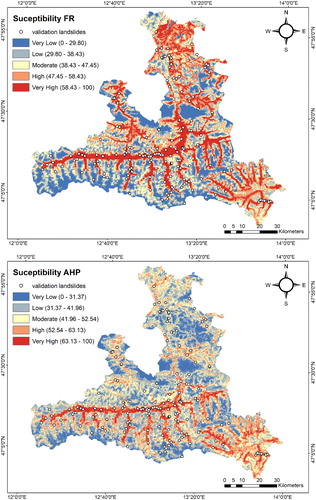
Table 1. Pairwise comparison point-based rating scale of AHP
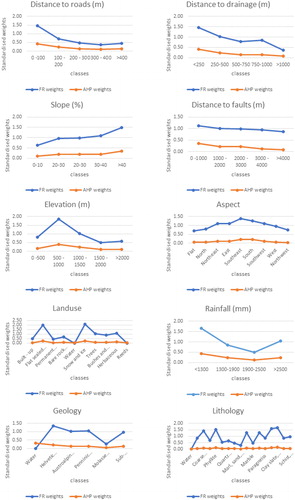
Table 3. Normalized weights for each factor and each of the classes based on the FR and AHP model.
Figure 5. Landslide susceptibility maps derived using the object-based approach of geon using weights from FR and AHP.
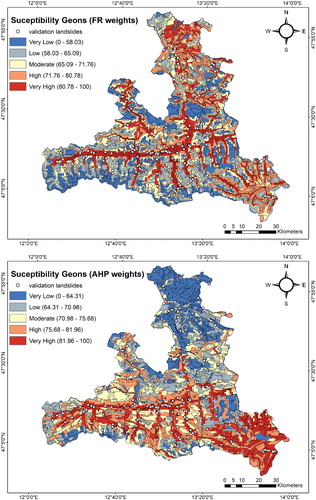
Figure 6. Selected geon for the impact assessment of each conditioning factor on the final susceptibility map using the geon approach based on FR weights.
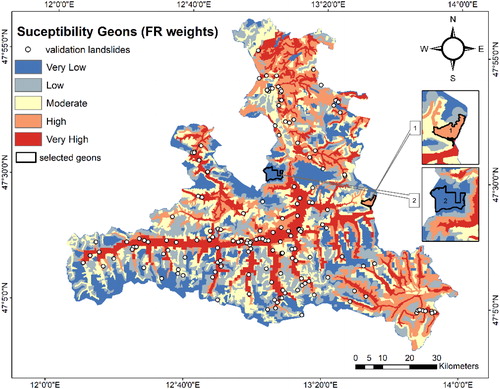
Figure 7. Impact of each conditioning factor at location one based on the geon approach using FR weights.
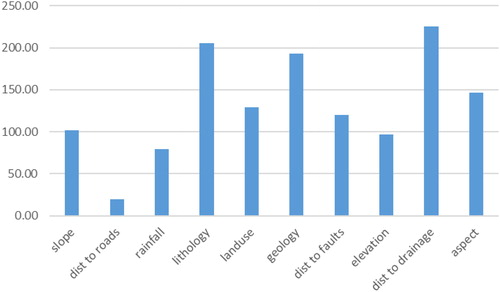
Figure 8. Impact of each conditioning factor at location two based on the geon approach using FR weights.
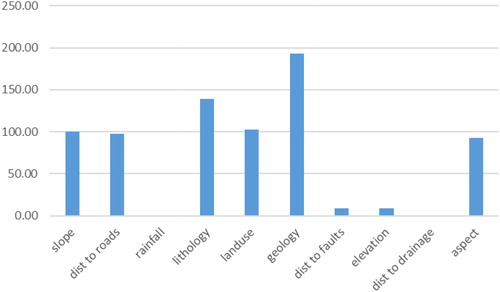
Figure 9. Selected geon for the impact assessment of each conditioning factor on the final susceptibility map using the geon approach based on AHP weights.
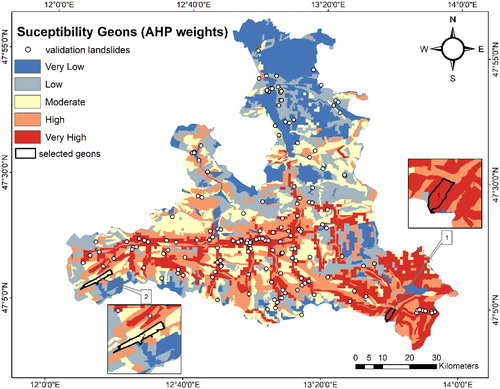
Figure 10. Impact of each conditioning factor in location 1 based on the geon approach using AHP weights.
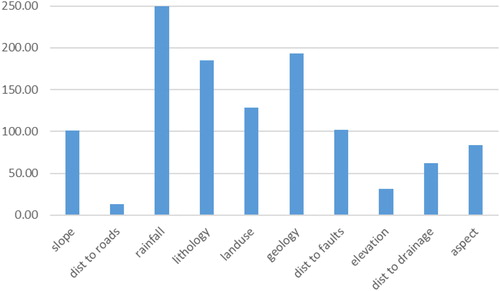
Figure 11. Impact of each conditioning factor at location two based on the geon approach using AHP weights.
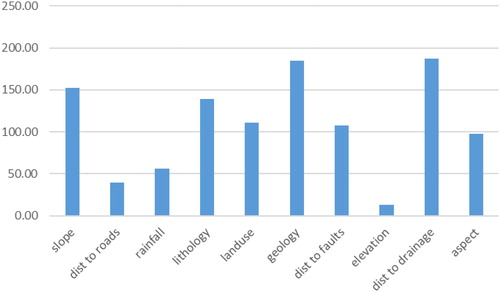
Figure 12. The ROC representing the quality method success rate curves for the FR, AHP, geon (FR), and geon (AHP) approaches using the validation landslide data.
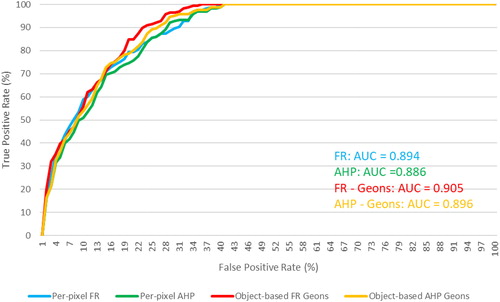
Figure 13. The ROC representing the quality method success rate curves for the FR, AHP, geon (FR), and geon (AHP) approaches using the training landslide data.
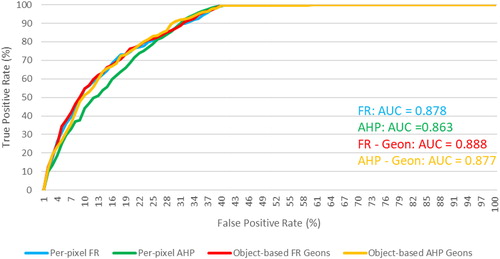
Table 4. R-indexes for the landslide susceptibility mappings (LSMs) of FR, AHP, Geon (FR) and Geon (AHP).
Figure 14. Results of R-index plots for AHP, FR and geon.
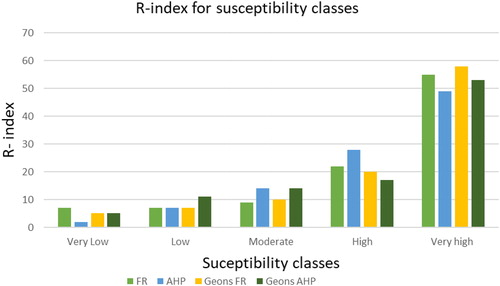
Figure 15. Comparison of the resulting weights for each factor and the classes based on the FR and AHP model.