
Figures & data
Figure 1. Experimental system.
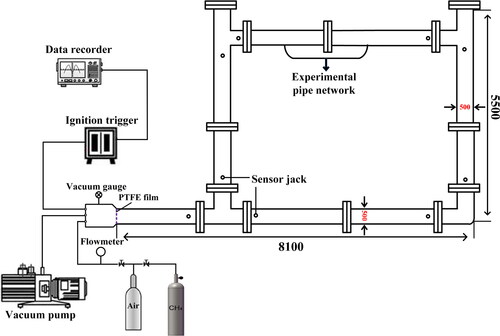
Figure 2. Schematic diagram of each pipe and measurement point in the experimental system.

Table 1. Equivalent coordinate values at each measurement point.
Figure 3. Scanning electron microscopy images of the coal dust samples at different magnifications.
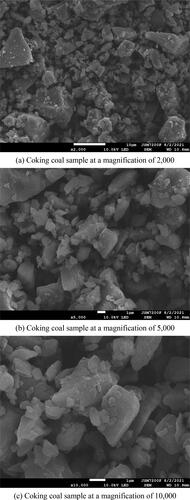
Table 2. Industrial analysis results of the coal block samples.
Figure 4. Particle size distribution of coal dust samples.
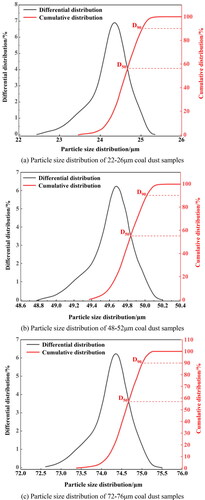
Figure 5. Variation law of peak pressure with mass of coal dust.
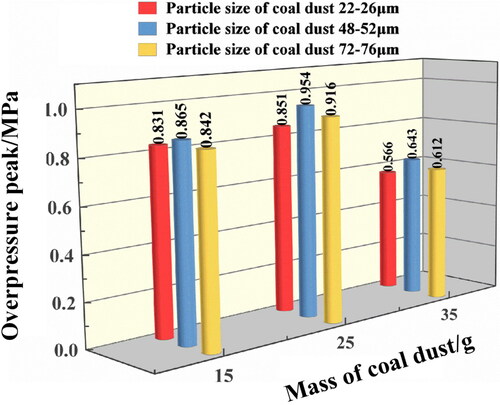
Figure 6. ‘O-A-C-D’ route flame front velocity with different mass of coal dust.
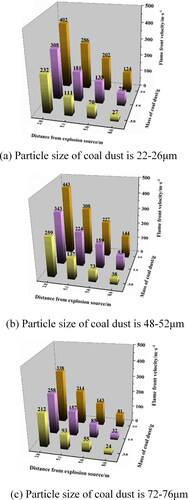
Figure 7. ‘O-A-B-D’ route flame front velocity with different mass of coal dust.
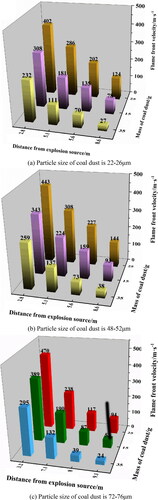
Figure 8. Temperature comparison at different measured points with different mass of coal dust.
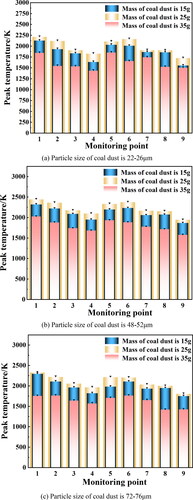
Figure 9. Variation law of pressure peak with particle size of coal dust.
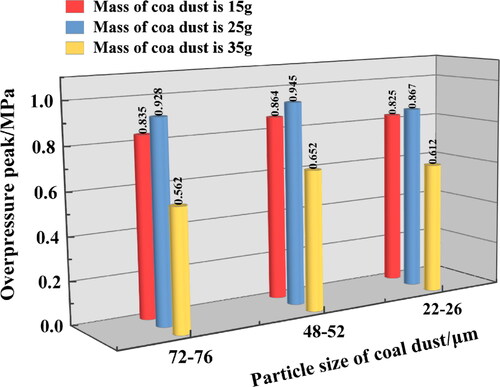
Figure 10. ‘O-A-C-D’ route flame front velocity with different particle sizes of coal dust.
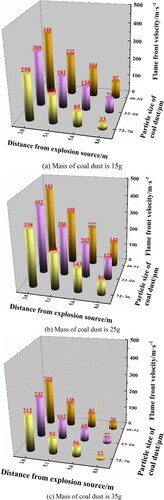
Figure 11. ‘O-A-B-D’ route flame front velocity with different particle sizes of coal dust.
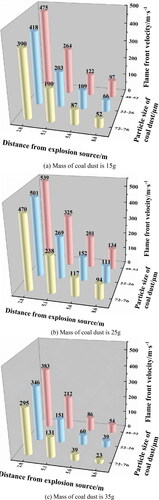
Figure 12. Temperature comparison in the coal dust measurement points with different particle sizes of coal dust.
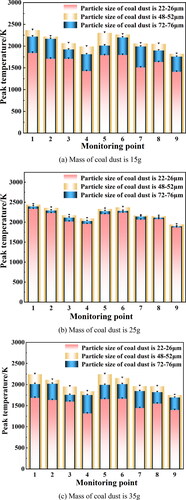
Table 3. Calculated variance relationships in the multiple regression model.
Data availability statement
The data and materials that support the results or analyses presented in our study are freely available.