
Figures & data
Figure 1. Landsat (OLI) image depicting the study area in the Piedmont zone basins starting from the left (1) Tangri, (2) Balaiali, (3) Begna, (4) Markanda, (5) Somb, and (6) Pathrala.
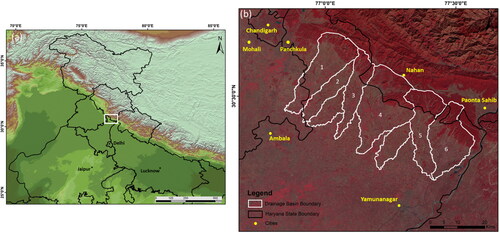
Figure 2. Geomorphological map of the study area prepared with files provided by BHUKOSH portal of Geological Survey of India (GSI).
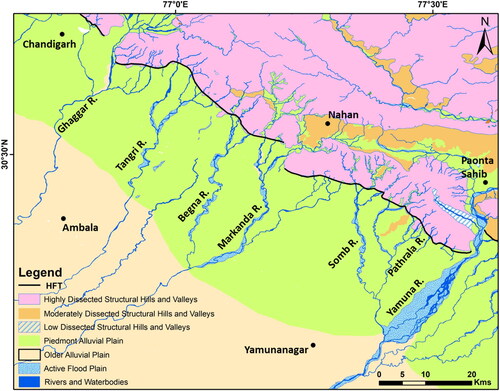
Figure 3. Major faults and lineaments present in the area deaped over SRTM 30 m DEM based hillshade image. (Modified from BHUKOSH portal and Seismotectonic Atlas of GSI, 59th publication, 2000).
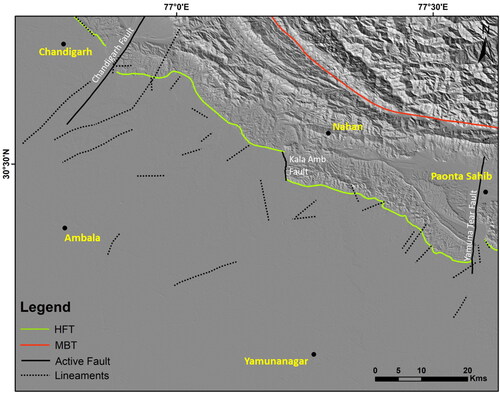
Table 1. Earthquake epicentres data around the HFT and Piedmont alluvial zone of Haryana.
Figure 4. Longitudinal river profiles with SL index for Tangri, Begna, Markanda, Somb, Pathrala and Baliali river basins, respectively.
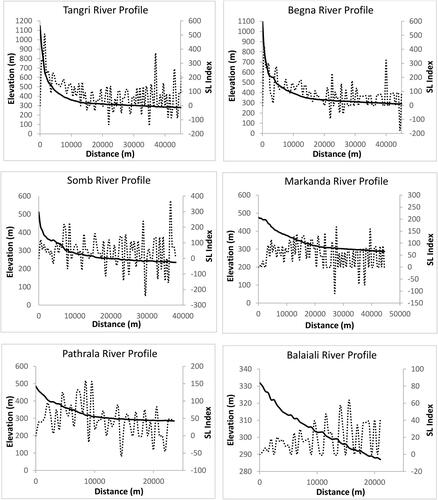
Figure 5. Hypsometric curve and hypsometric integral calculated for six drainage basins in the study area.
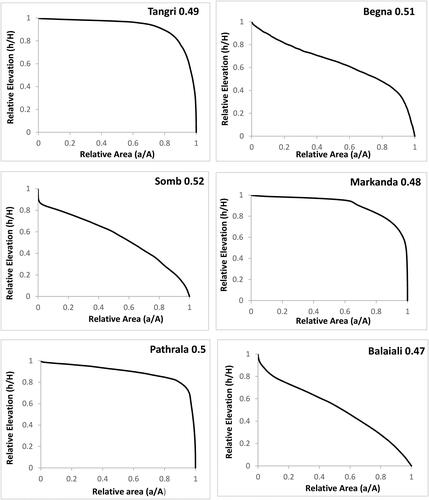
Table 2. Asymmetry factor (AF) value showing the tilt direction of the basins.
Figure 6. Different segments (S1–S10) of the mountain front on which Smf is calculated using the hillshade of the study area.
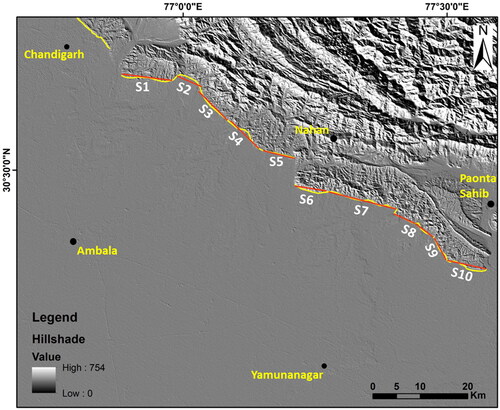
Table 3. Mountain front sinuosity values (Smf) calculated for 10 segments along the Himalayan front.
Figure 7. Cartosat-1 PAN ortho images showing fluvial anomalies observed along the course of rivers and seasonal rivulets debouching from Siwalik hills. Drainage anomalies viz. rectilinearity, river segment anomalies, river offsets bends, and lineaments are marked by black dashed line.
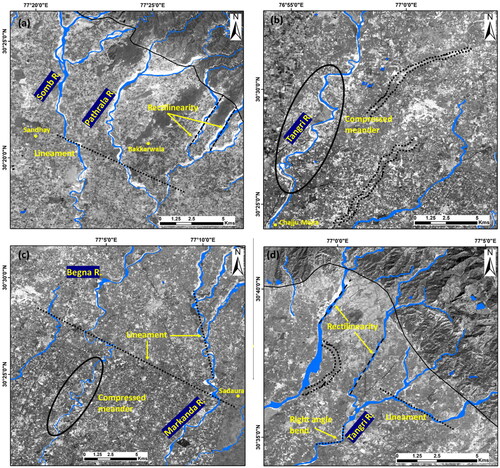
Figure 8. Google Earth imagery of the Markanda and Begna rivers showing their present channel and the paleochannels. PC-M and PC-B are the older paleochannels of the Markanda and Begna rivers, respectively.
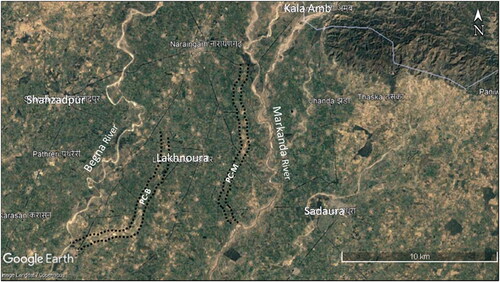
Figure 9. Field photographs showing evidences of recent tectonics in the Piedmonts: (a) Unpaired river terraces of Somb river, (b) vertical incision of river valley and mid channel bars in the present channel of Markanda river, (c) clay and gravel alternating layers with bend in clay bed, and (d) recently deposited mass flow debris in front of piedmonts.
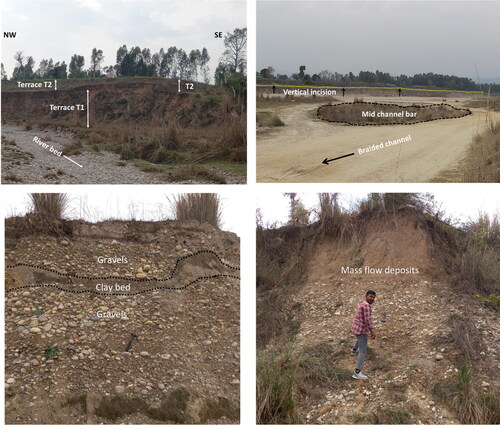
Figure 10. SRTM 30 m DEM based transverse topographic profiles (perpendicular to HFT).
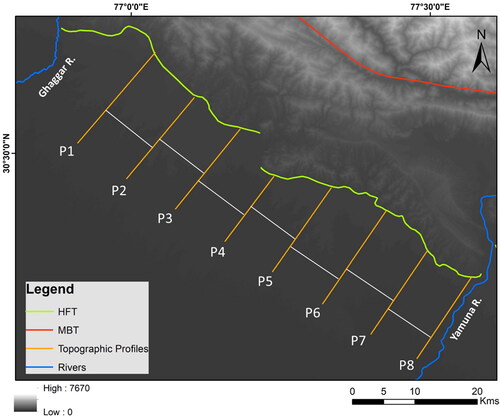
Figure 11. Potential locations of active tectonic features (fault scarps, lineaments) based on subtle topographic breaks unrelated to piedmont slope.
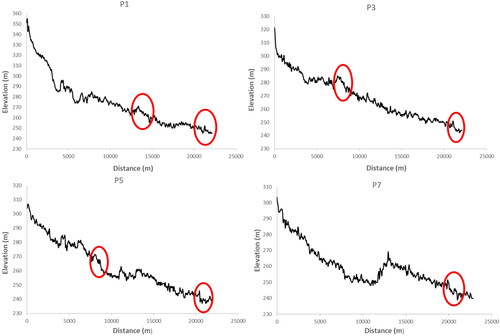
Figure 12. Anomaly map showing locations of drainage anomalies and topographic breaks in the study area. (Landsat TM standard FCC mosaic is used as background).
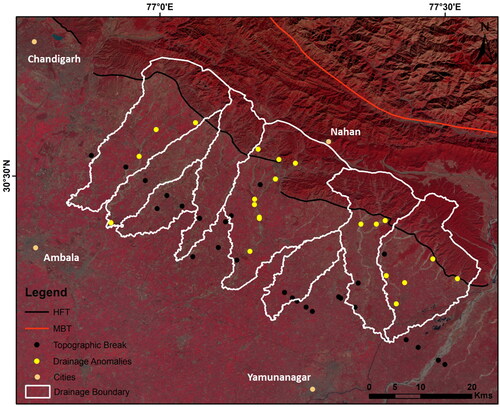
Figure 13. Spatial frequency distribution of historical seismicity and abundance of active tectonic features in the Himalayan foothills and piedmont region in and around HFT.
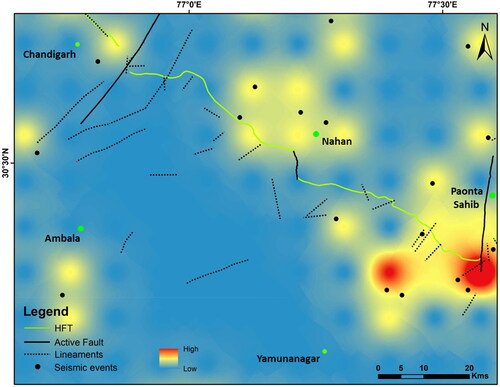
Figure 14. Elevation profile of the uplifted part of study area (NW-SE), from east the Pathrala and Somb rivers are present and towards their west is an uplifted zone with ∼25-30 m uplifted block along the paleochannels of the Nakti and Vedic Saraswati rivers. The PC-N1 and PC-N2 are the paleochannels of Nakti river, which has abandoned its course and has shifted towards the west; PC-Y is the paleochannel of the Yamuna river.
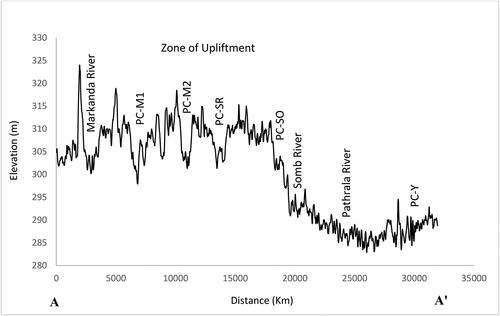
Figure 15. Shaded relief map of the uplifted zone of study area, PC-N1, and PC-N2: Nakti river paleochannels, PC-SR: Saraswati river paleochannel, PC-Y: Yamuna river paleochannel. The solid black circle represents the central axis of the uplifted zone.
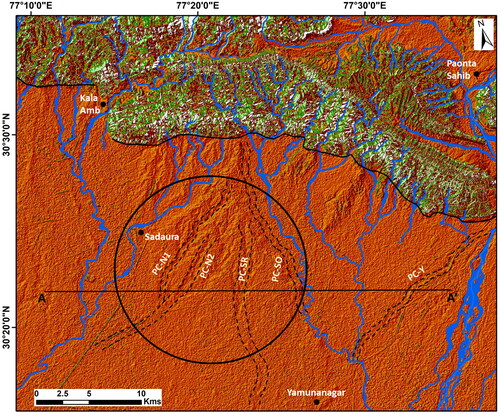
Figure 16. (a) Survey site selected in Begna river bed near Sadaqpur village in Haryana where the stream takes right angle bend, (b) abrupt topographic break of about ∼10 m (possible location of fault) striking – northwest and (c) GPR Profile is 70 m long, oriented north-south; 2-D radargram shows possible locations of faults and warped surfaces marked in black lines.
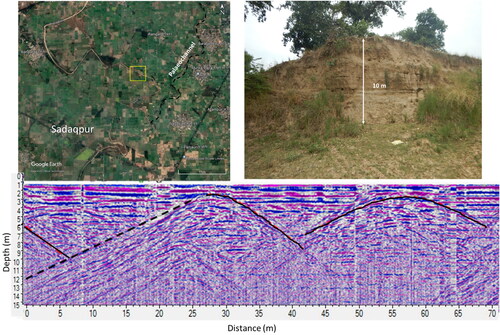
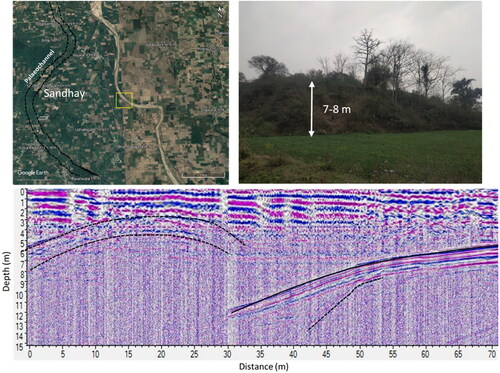
Figure 17. (a) Survey was done in Somb river near Sandhay village of Haryana in NE-SW direction (b) a significant topographic break of about 7-8 m abutting against a palaeochannel and (c) GPR profile for the site using 40 MHz antennae. 2-D radargram profile indicate traces of fault marked in solid black lines dipping towards northern side. A warped surface could also be seen before the fault line.
Data availability
The data used to support the findings in this study will be available by the corresponding author upon reasonable request. Restrictions are applied to data, such as GPR radargrams.