
Figures & data
Figure 1. Schematic diagram of the study area.
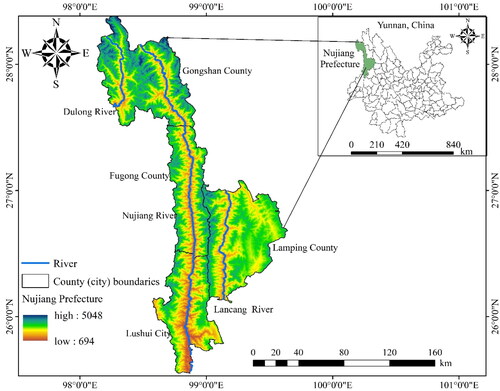
Figure 2. Schematic diagram of the gully.
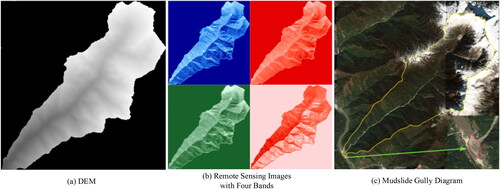
Table 1. How the sample was classified.
Table 2. Detailed results of data enhancement.
Figure 3. Experimental flow chart.
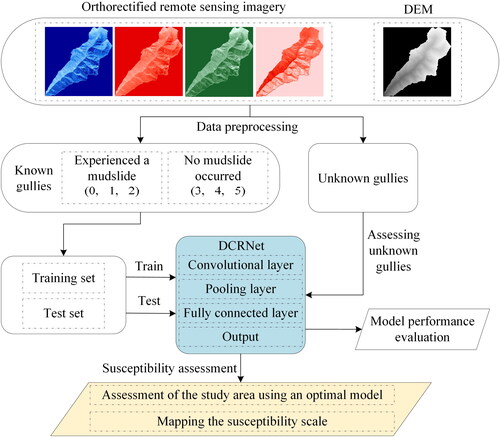
Figure 4. Model structure diagram.
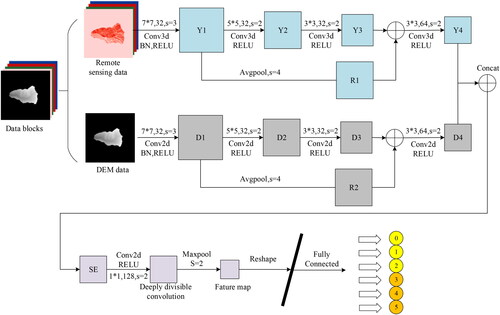
Figure 5. Diagram of the improved residual structure.
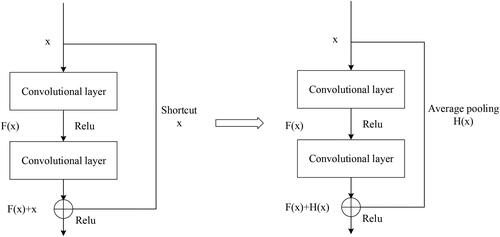
Figure 6. SENet structure diagram.
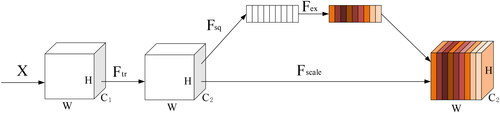
Figure 7. Deeply divisible convolutional structure diagram.
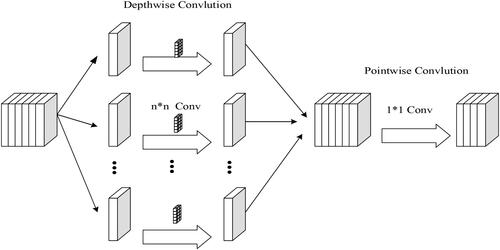
Table 3. Experimental results for (9:1) training test set division.
Table 4. Experimental results for (8:2) training test set division.
Table 5. Experimental results for (7:3) training test set division.
Figure 8. Accuracy curve.
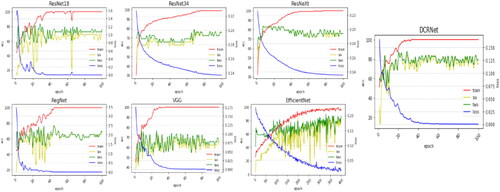
Figure 9. Receiver operating characteristic curve.
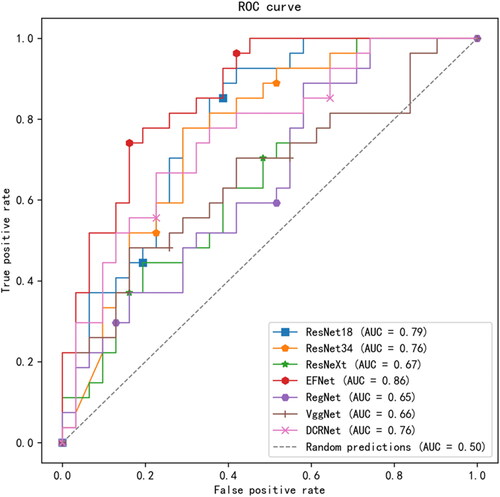
Table 6. Results of ablation experiments.
Table 7. Experimental results of the loss function.
Table 8. Experimental results for different learning rates.
Figure 10. Map of susceptibility areas.
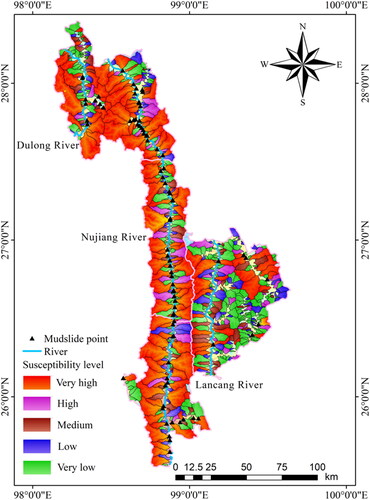
Table 9. Details of different levels of susceptibility.
Figure 11. Visualisation of susceptibility zoning.
Figure 12. Schematic diagram of a typical gully.
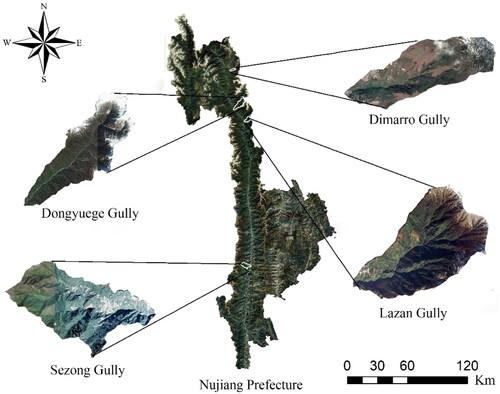
Table 10. Potential hazards of gullies.
Figure 13. Map of slope direction, gradient, curvature and network characteristics.
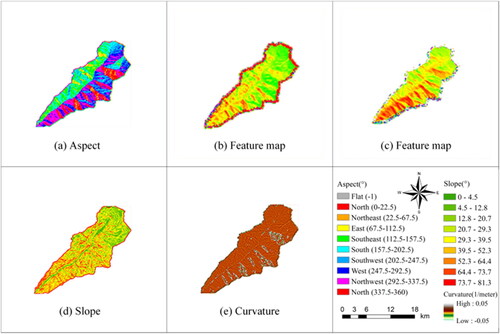
Figure 14. Map of elevation difference threshold intervals.
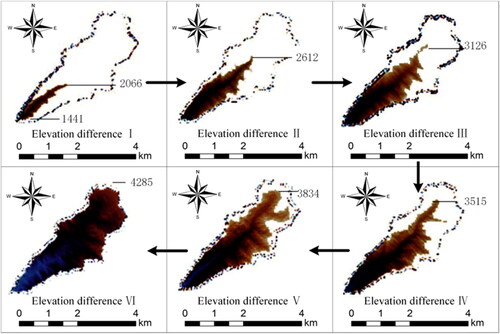
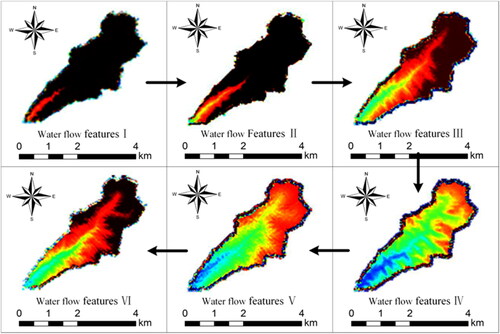
Figure 15. Map of the evolution of the water system.
Data availability statement
The data that support the findings of this study are available from the corresponding author upon reasonable request.
Remote sensing optical images are selected from National Platform for Common Geospatial Information Services and the link is https://www.tianditu.gov.cn/.
DEM data is obtained from Shuttle Radar Topography Mission (SRTM) data and the link is https://lpdaac.usgs.gov/products/srtmgl1v003/.