
Figures & data
Figure 1. Geographical location of Shenzhen city.
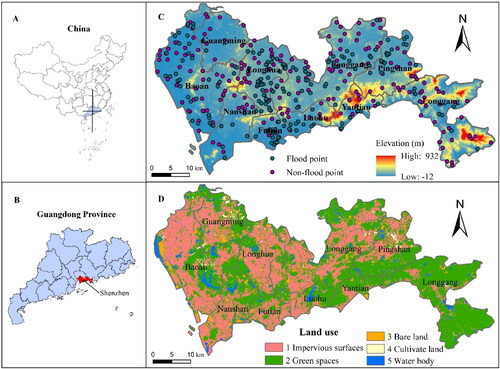
Table 1. Landscape pattern index.
Table 2. Feature variables (the serial number in the names of landscape pattern features correspond to the serial number of land use type in Figure 1D).
Table 3. Experimental protocol.
Figure 2. Technical framework for urban waterlogging susceptibility assessment.
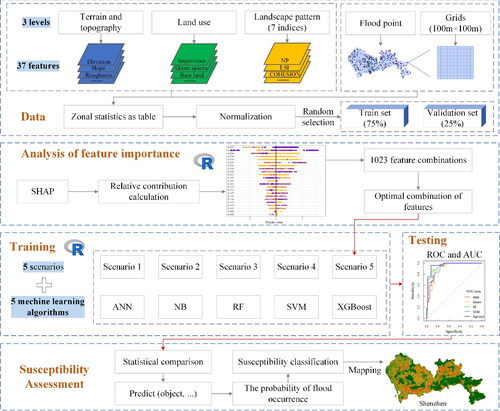
Figure 3. SHAP-based feature importance distribution.
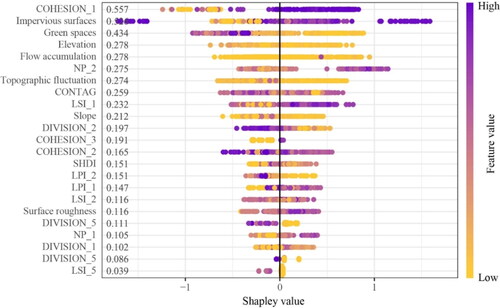
Figure 4. Comparison of the AUC values of each classifier with different feature combinations.
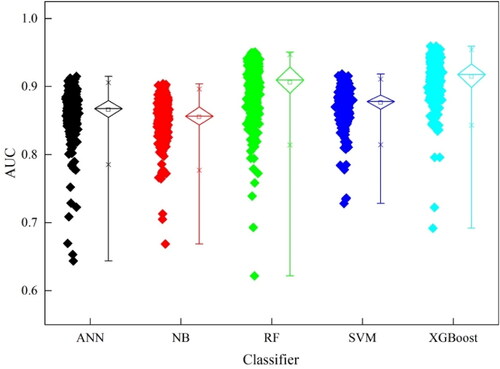
Table 4. Feature combinations for each classifier to obtain the maximum AUC.
Figure 5. The number of different feature types in the optimal feature combination (A) and the proportion of their Shapely values (B).
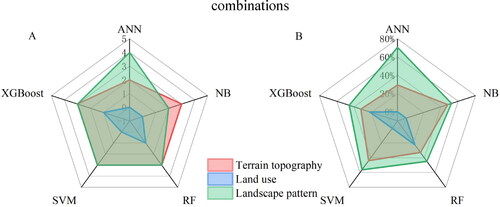
Figure 6. AUV values of each classifier in different scenarios (A) and their ROC (B).
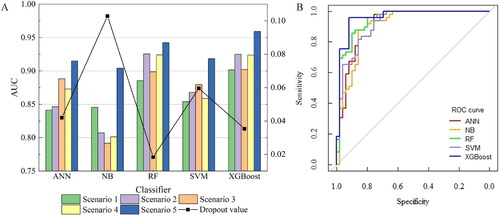
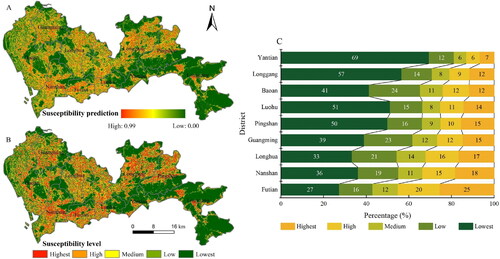
Figure 7. XGBoost-based urban flooding susceptibility prediction (a), susceptibility level classification (B), and zoning statistics (C).
Data availability statement
Data will be made available on request.