
Figures & data
Figure 1. (a) Engineering geological map of Suryabinayak Municipality and surrounding areas with data acquisition points (redrawn and modified after Shrestha et al. (Citation1998). Source: Department of Mines and Geology (DMG), Nepal. (b) Stratigraphic cross section profile of Bhaktapur district from South (S) to North (N). Redrawn and modified after Kawan et al. (Citation2019)
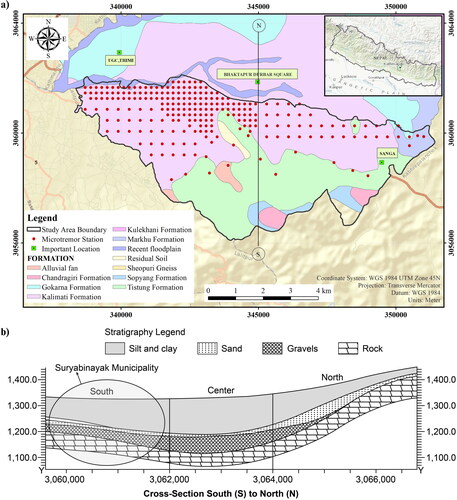
Figure 2. (a) Instrumentation for the data acquisition; (b) comparison of frequency obtained from geophone and accelerometer.
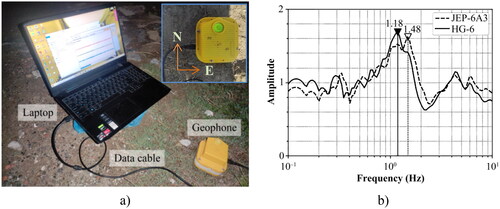
Figure 3. Microtremor measurement station in 200 × 200 m and 400 × 400 m grid spacing and location of building considered. B = building.
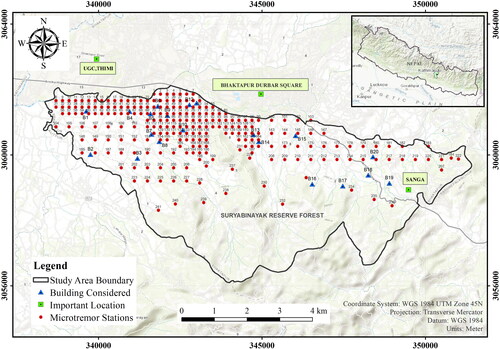
Table 1. Guidelines recommended by SESAME (Citation2004) for microtremor data acquisition.
Figure 4. Typical velocity time history graph of measured data; (a) vertical direction (UD); (b) North-South (NS) direction; (c) East-West (EW) direction.
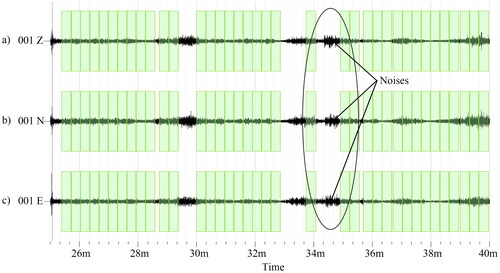
Figure 5. Representative picture for microtremor measurements of building ID (a) B9 and (b) B12; data acquisition of the building on (c) the top floor and (d) the bottom floor of the building (B12).
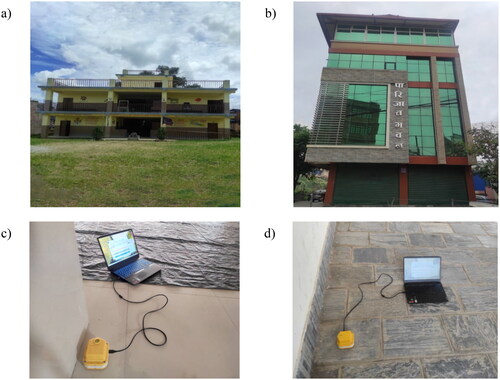
Figure 6. Representative Horizontal to Vertical Spectral Ratio (HVSR) graph of microtremor measurement stations. The black line represents the average H/V spectra graph; the dotted line represents the average H/V ± standard deviation
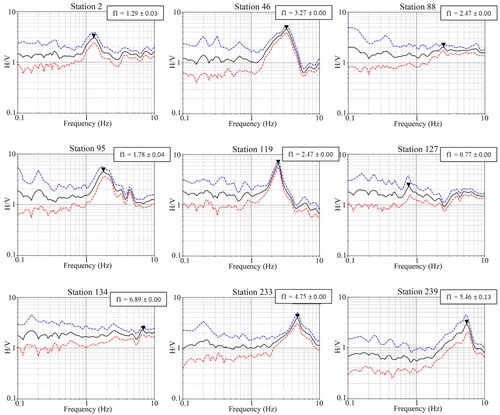
Figure 7. (a) Frequency-based microzonation map of the study area and resonance possibility of buildings with soil. B = building. (b) Stratigraphic features of Borehole BH1 and BH2. Source: modified after Kawan et al. (Citation2019).
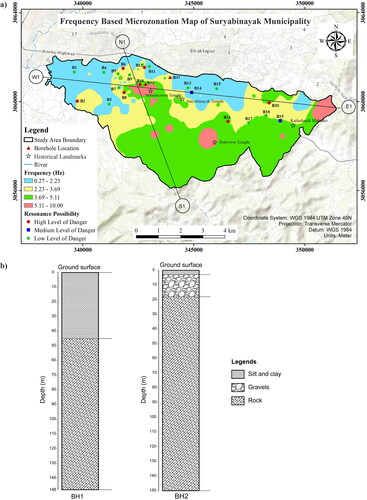
Figure 8. Frequency-based cross-sectional profile along (a) S1-N1 (transverse direction) and (b) W1-E1 (longitudinal direction) of the study area.
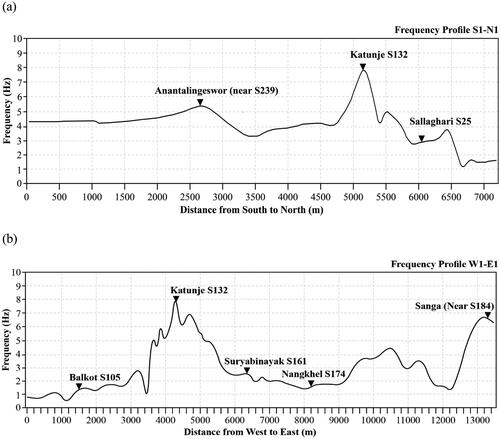
Figure 9. Floor Spectral Ratio (FSR) vs frequency (Hz) for B6; B9; B16 and B19.
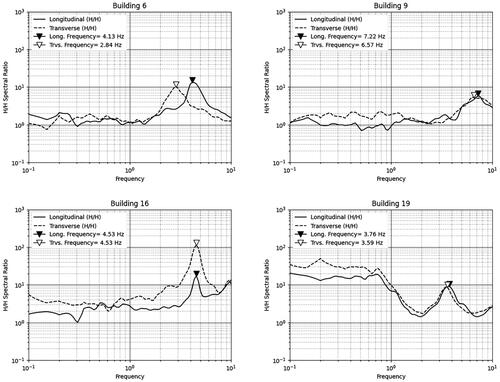
Table 2. Soil-structure resonance possibility of all measured buildings.
Figure 10. Fundamental frequency and height relationship of surveyed building (a) along longitudinal direction; and (b) along transverse direction.
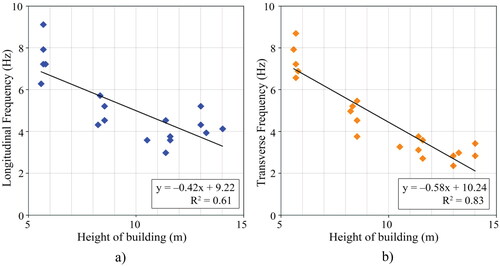
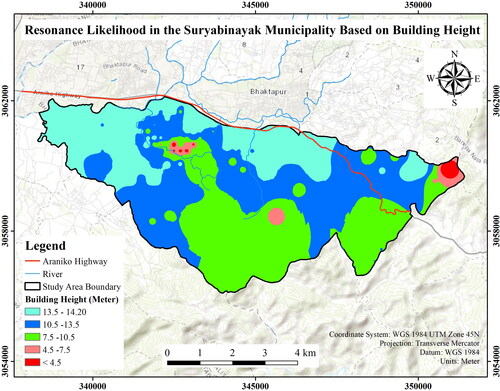
Figure 11. Soil-structure resonance possibility of Suryabinayak Municipality based on height of building.
Data availability statement
The data underlying this article will be shared on the reasonable request to the corresponding author.