
Figures & data
Figure 1. Location of the study area (a) and kernel density map of landslides (b).
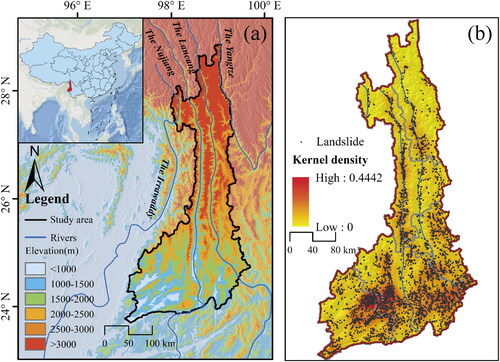
Table 1. Detailed information of the data.
Figure 2. Methodological framework of this study.
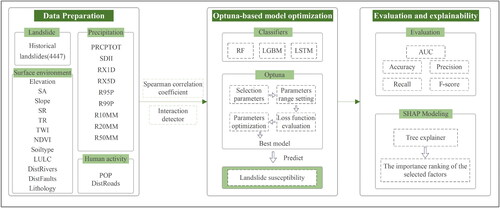
Figure 3. Spatial distribution of precipitation factors. (a) PRCPTOT; (b) SDII; (c) RX1D; (d) RX5D; (e) R95P; (f) R99P; (g) R10MM; (h) R20MM; (i) R50MM.
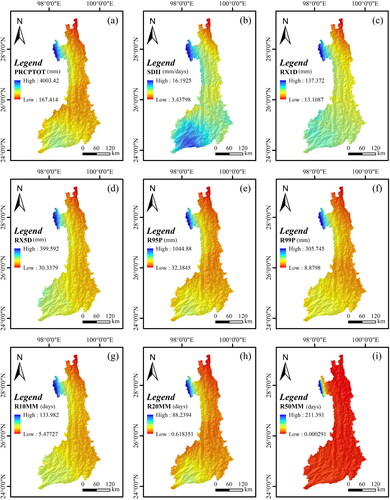
Table 2. Definition of precipitation index.
Figure 4. Spatial distribution of the surface environment factors. (a) Elevation; (b) SA; (c) Slope; (d) LULC; (e) SR; (f) TR; (g) TWI; (h) Lithology; (i) NDVI; (j) DistRivers; (k) DistFaults; (l) Soiltype.
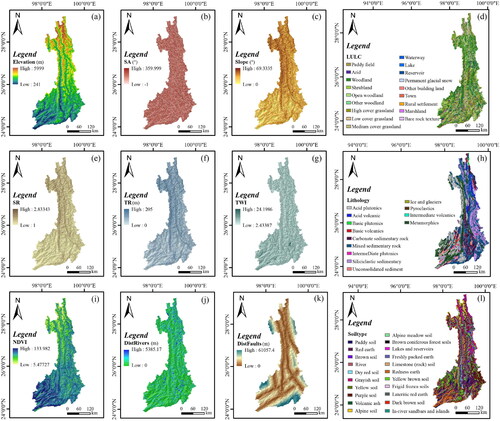
Figure 5. Spatial distribution of human activity factors. (a) POP; (b) DistRoads.
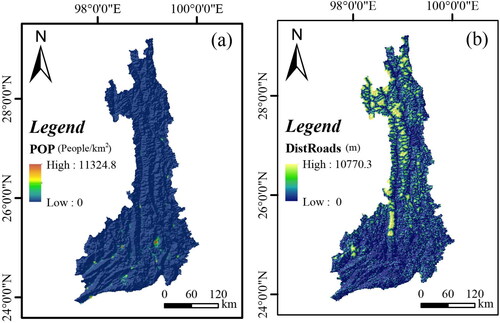
Table 3. Types of interaction between two covariates.
Table 4. Hyperparameter search spaces of three models.
Figure 6. Spearman correlation coefficient between landslides and influence factors.
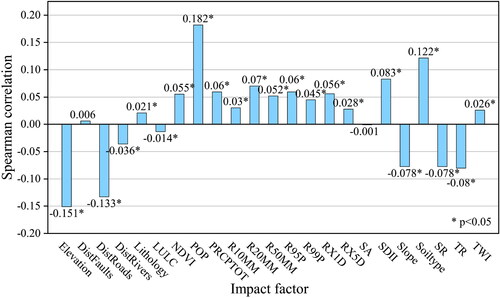
Figure 7. Interaction effects of influence factors of landslide based on geodetector (red indicates enhanced, bi; blue indicates enhanced, nonlinear).
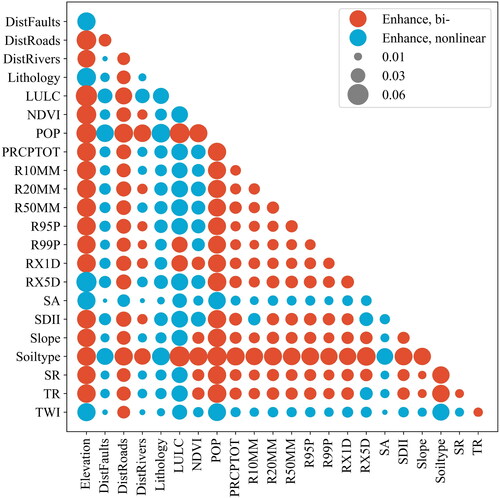
Figure 8. (a) Receiver operating characteristic curves for the training set; (b) Receiver operating characteristic curves for the test set.
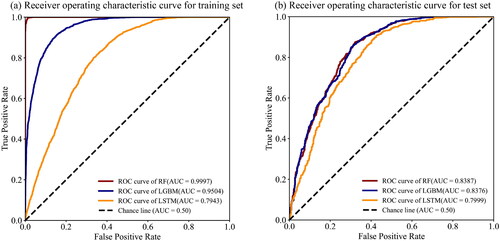
Table 5. Results of model accuracy evaluation.
Figure 9. Landslide susceptibility map.
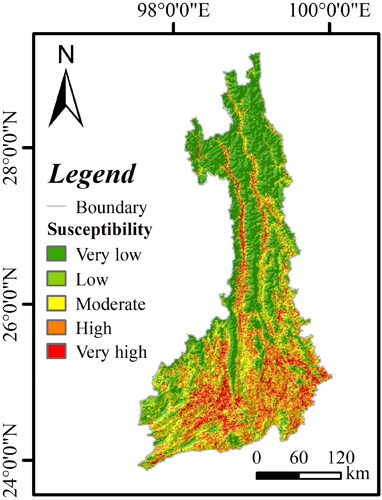
Table 6. Landslide susceptibility zoning statistics.
Figure 10. SHAP-based feature importance. (a) Factor importance plot; (b) summary plot of SHAP.
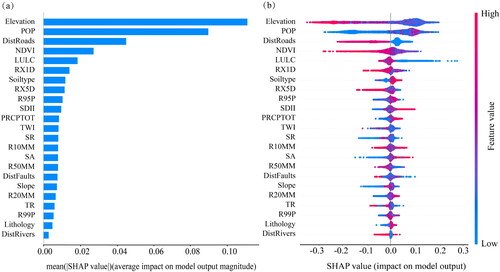
Table 7. Performance metrics for RF model under different hyperparameter optimization methods.
Figure 11. Importance of features built into the RF model.
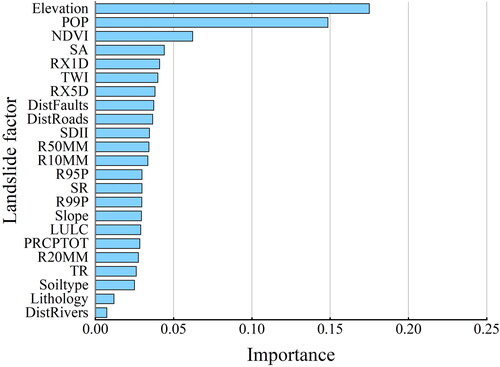
Table 8. Model prediction accuracy of the RF model using 22 or 23 drought factors.
Data availability statement
The data presented in this study are available on request from the corresponding author.