
Figures & data
Figure 1. The flowchart of a side-sampling method for landslide susceptibility assessment.
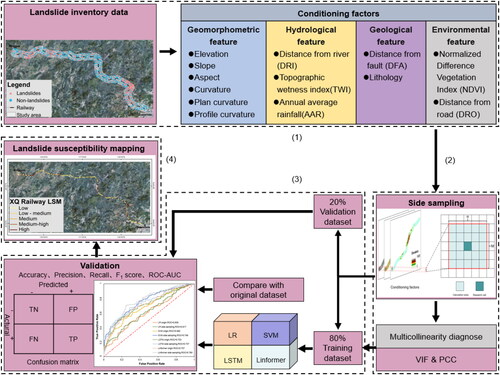
Figure 2. Diagrammatic sketch of the side-sampling method.
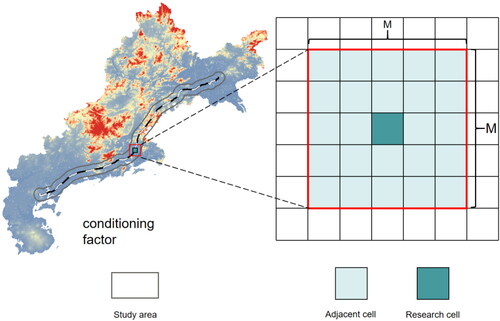
Figure 3. Geo-graphical location map of the three study areas.
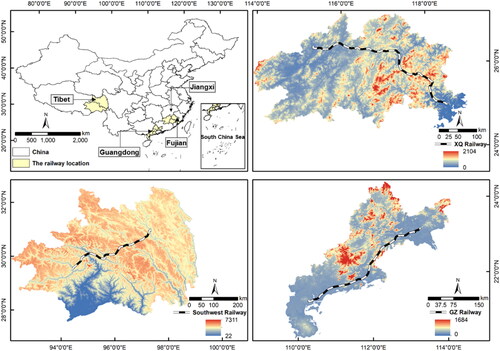
Figure 4. Landslide inventories distribution in the study area: (a) XQ railway; (b) the southwest railway; (c) GZ railway.
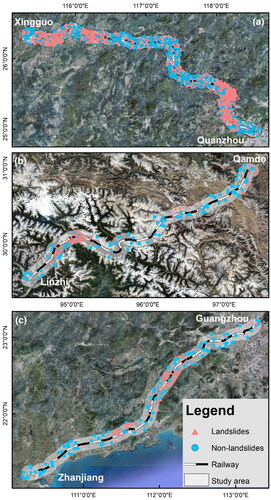
Table 1. Predictive performance of model testing dataset.
Figure 5. VIF testing results.
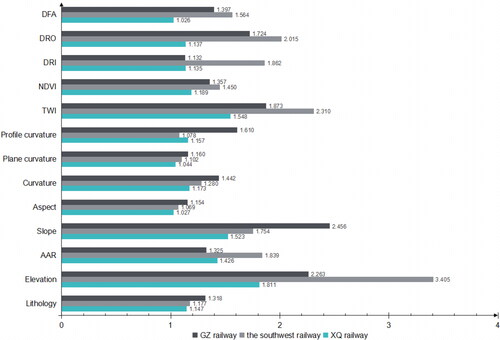
Figure 6. PCC testing: (a) XQ railway; (b) the southwest railway; (c) GZ railway.
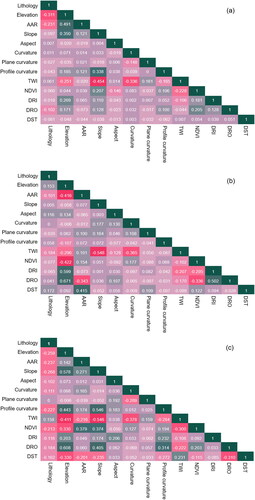
Figure 7. ROC curves: (a) XQ railway; (b) the southwest railway; (c) GZ railway.
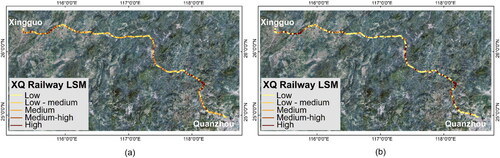
Figure 8. LSM of XQ railway: (a) original; (b) side-sampling.
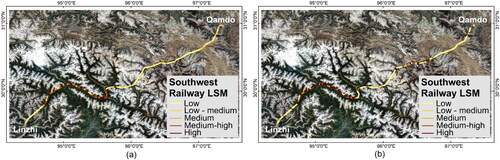
Figure 9. LSM of the southwest railway: (a) original; (b) side-sampling.
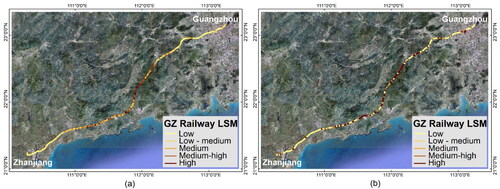
Figure 10. LSM of GZ railway: (a) original; (b) side-sampling.
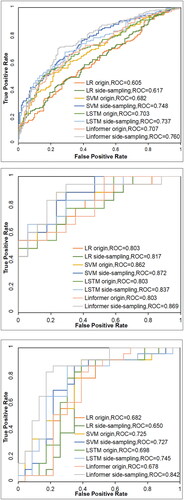
Table 2. Data types and sources.
Figure 11. LSM of XQ railway: (a) LR; (b) SVM; (c) LSTM; (d) Linformer.
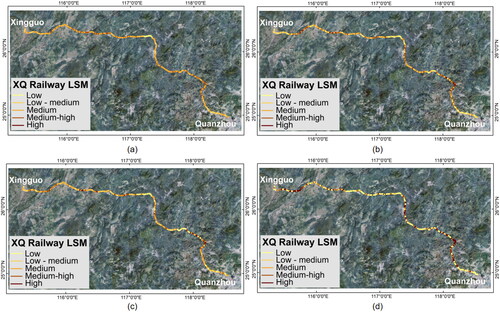
Figure 12. LSM of the southwest railway: (a) LR; (b) SVM; (c) LSTM; (d) Linformer.
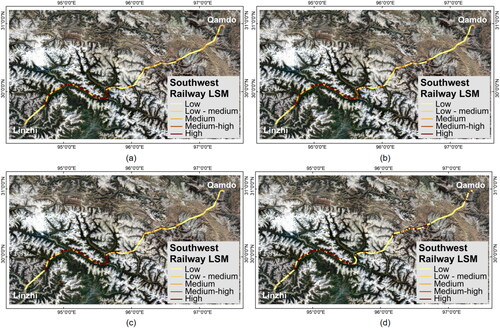
Figure 13. LSM of GZ railway: (a) LR; (b)SVM; (c) LSTM; (d) Linformer.
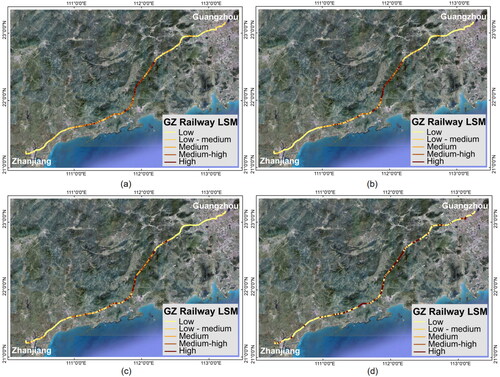
Figure 14. Modelling capabilities of different sampling methods.
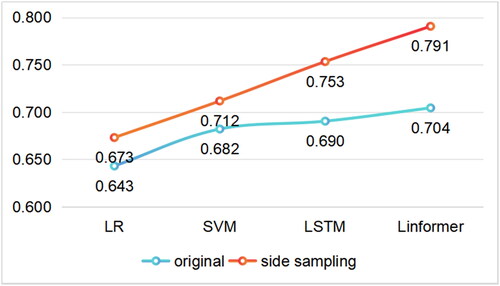
Table 3. Comparison of M = 3 and M = 5 performance.
Data availability statement
All the data, models or code generated or used in the present study are available from the corresponding author by request.