
Figures & data
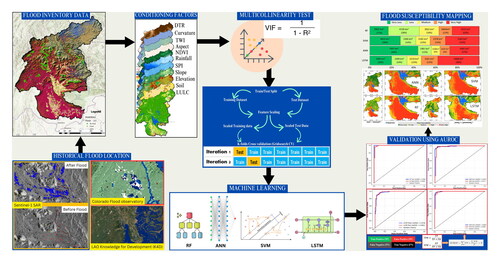
Figure 1. The location of the Nam Ngum River Basin and photographs of flooded areas; (a,f) Thalat, (b) Tanpiao, (c) Thangon riverside, (d) Thangon, (e) Thasavang (Sources: a and f. photo credit: pilot bountem souphamixay, b. photo credit: pilot cap vanh mahayo, c. www.muan.sanook.com, d. www.vientianetimes.org.la, e. Photo credit: Ly vannaly).
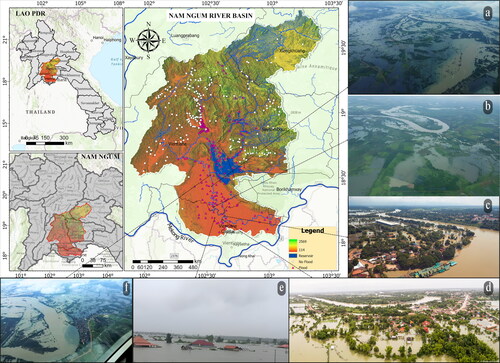
Figure 2. The methodology involved in the flood susceptibility modeling.
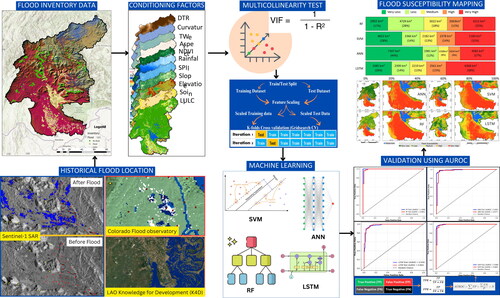
Table 1. Description of Sentinel-1 data.
Table 2. Description of data used in the study.
Figure 3. Flood conditioning factors.
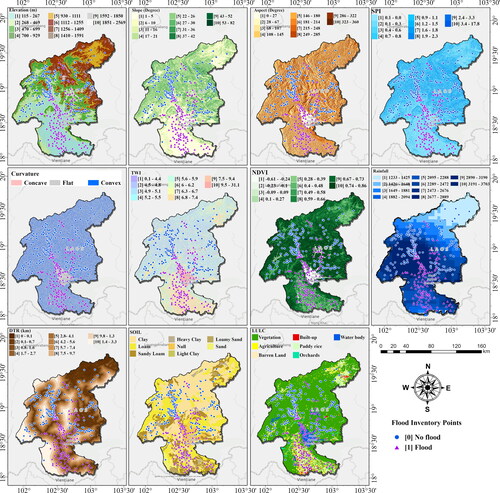
Figure 4. Assessment of flood conditioning factors based on (a) Variance inflation factor, (b) Tolerance, (c) Pearson correlation, and (d) Information gain ratio.
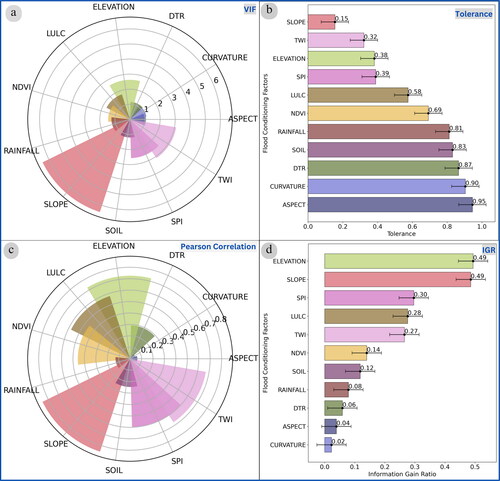
Figure 5. AUROCs For all models, (a) random forest, (b) artificial neural network, (c) long short-term memory, and (d) support vector machine.
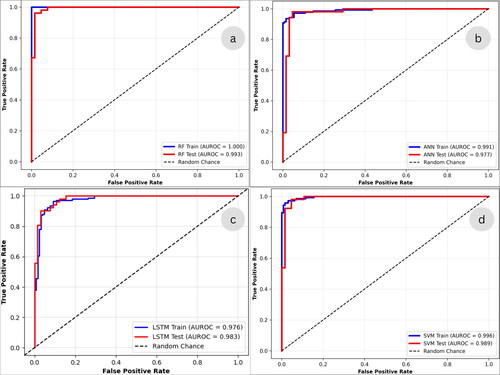
Figure 6. Performance of the models: (a) confusion matrix; (b) MSE and RMSE, and (c) precision and accuracy assessment parameters.
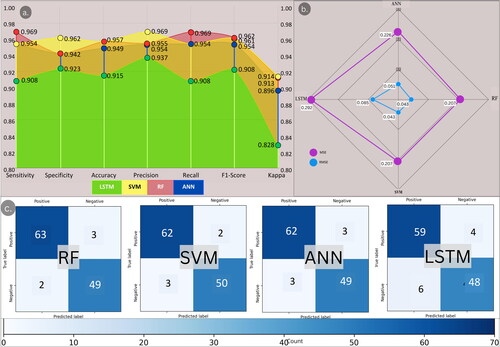
Figure 7. Flood susceptible areas in percentage and sq. km obtained from support vector machine, random forest, artificial neural network, and long short-term memory.
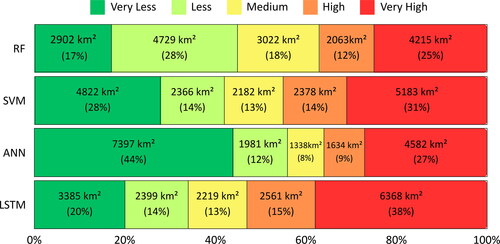
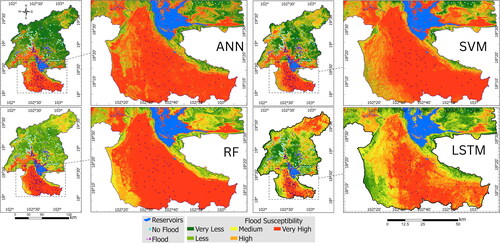
Figure 8. Flood susceptibility maps generated from machine learning models.
Data availability statement
The data supporting this study’s findings are available on request from the authors.