Figures & data
Figure 1. The process of site selection.
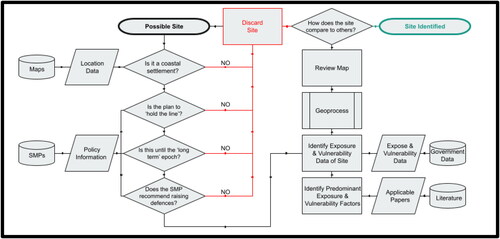
Figure 2. Demonstration of the components of a geospatial raster. Elevation values are contained within the two-dimensional cell, size dependent on the resolution of the raster.
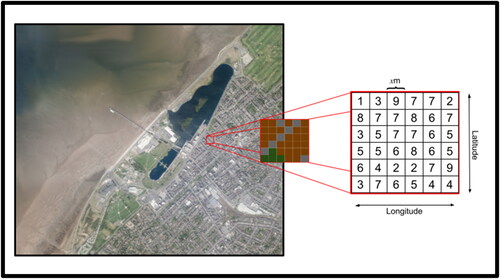
Figure 3. Two DSMs overlaid: the blue line (older DSM) and the red line (newer DSM) (left panel); the resulting DoD (Xm) from the above differential analysis, using EquationEquation 1(1)
(1) (right panel).
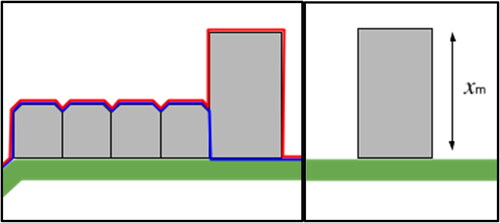
Figure 4. The t-distribution approaching the normal distribution as (n ➝ ∞), where the degree of freedom, df, is n-1.
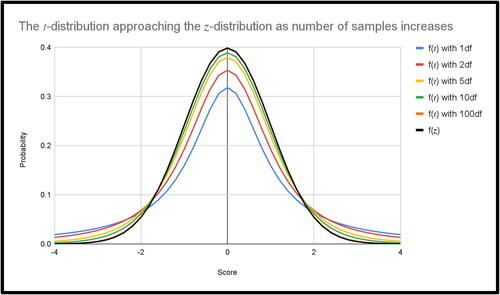
Figure 5. Map of the structural flood protection schemes development across Portsea Island from 2000 to 2020. This map does not include the currently in development Southsea scheme.
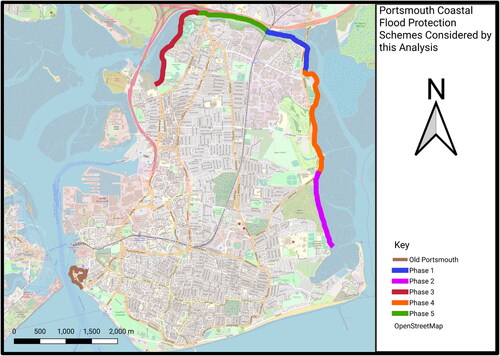
Figure 6. Portsmouth 2005 and 2013 LiDAR DSM comparison. Southwest Portsmouth extract is inset (OpenStreetMap).
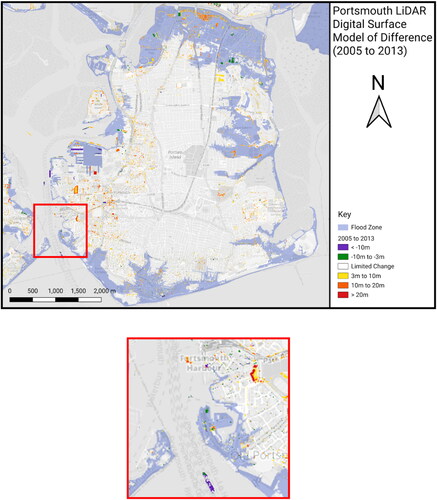
Figure 7. Portsmouth 2013 and 2020 LiDAR DSM comparison. Southwest and northwest Portsmouth extracts are inset (OpenStreetMap).
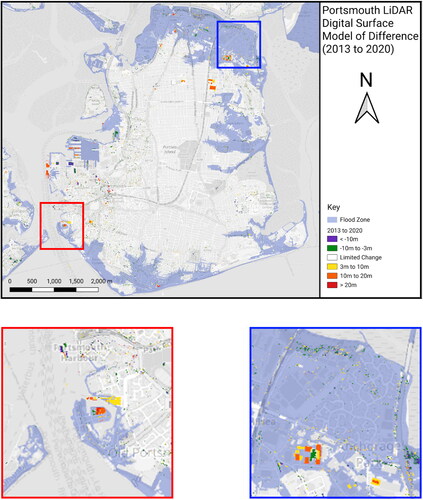
Figure 8. Gosport 2005 and 2013 LiDAR DSM comparison (OpenStreetMap).
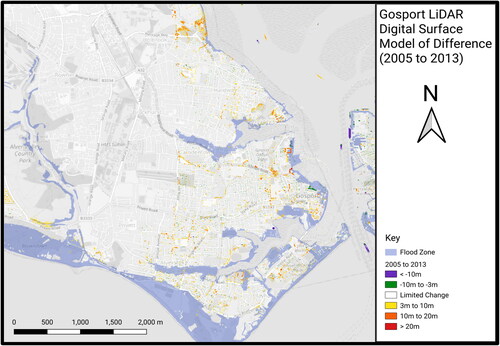
Table 1. The results of the portsmouth raster t-test comparing the 2002 raster to the 2013 raster, and the 2013 raster to the 2022 raster (3dp).
Figure 9. Gosport 2013 and 2020 LiDAR DSM comparison (OpenStreetMap).
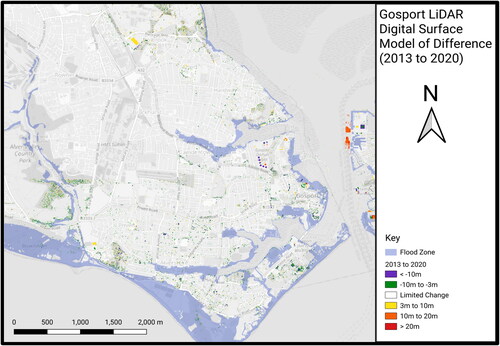
Figure 10. Weston-super-Mare 2003 and 2022 LiDAR DSM comparison. Northwest Weston-super-Mare is inset (OpenStreetMap).
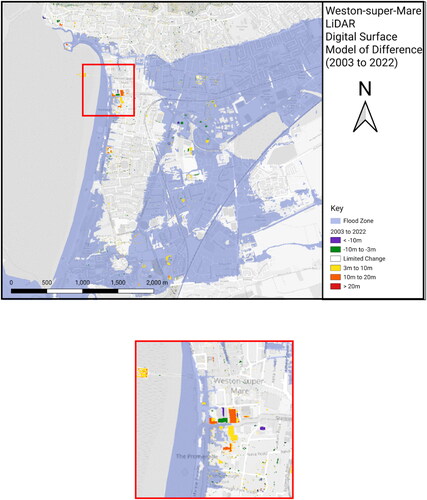
Figure 11. Clevedon LiDAR 2003 to 2022 DSM comparison (OpenStreetMap).
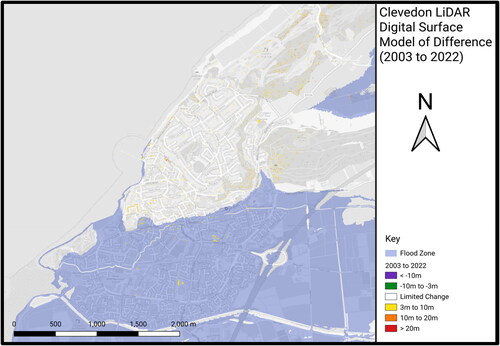
Figure 12. Burnham-on-Sea LiDAR 2003 to 2022 DSM comparison (OpenStreetMap).
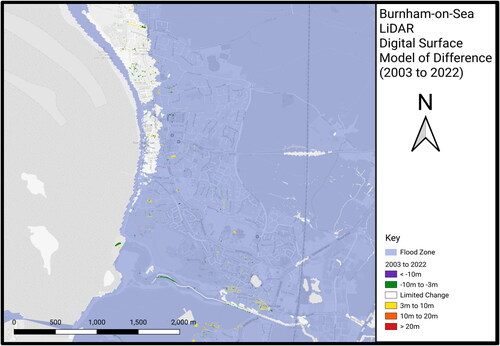
Table 2. The results of the Weston-super-Mare raster t-test comparing the 2007 raster to the 2014 raster, and likewise for the Burnham-on-Sea and Clevedon rasters (3dp).
Figure 13. Southport 1999 and 2022 LiDAR DSM comparison. Central-west Southport is inset (OpenStreetMap).
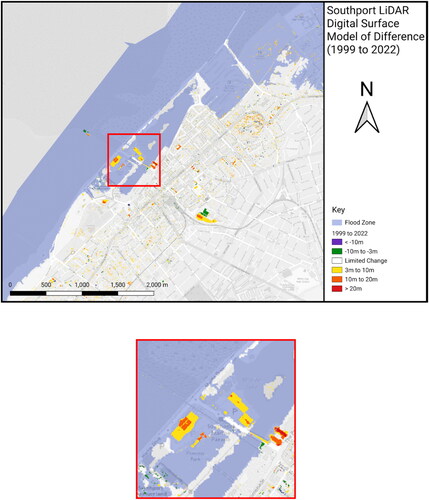
Figure 14. Crosby LiDAR 2002 to 2022 DSM comparison (OpenStreetMap).
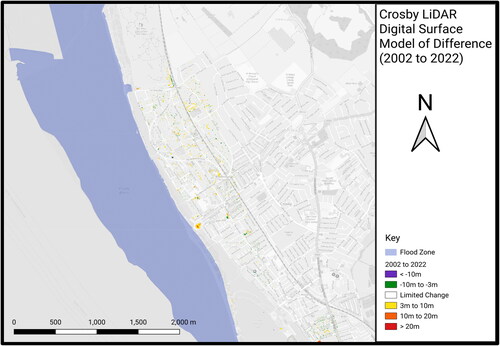
Figure 15. Blackpool LiDAR 1999 to 2022 DSM comparison (OpenStreetMap).
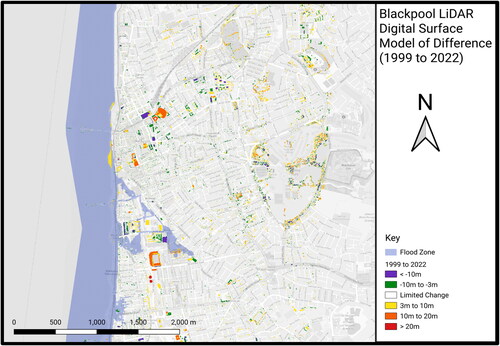
Table 3. The results of the Southport raster t-test comparing the 2007 raster to the 2014 raster, and likewise for the Blackpool and Crosby rasters (3dp).
Table 4. Summary table of the results from the raster t-tests in primary locations. These locations had a structural coastal flood defence constructed halfway between the rasters mentioned (3dp).
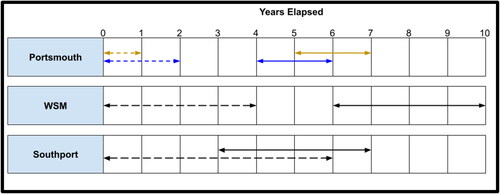
Figure 16. Relative timeline of structural coastal flood defence construction or upgrading (dashed) and nearby exposed urban development (solid) since the start of the scheme. Portsmouth arrows are colour-coordinated to those used to schemes with associated development in .