
Figures & data
Figure 1. Validation—Peak strain variation for different dip angles.
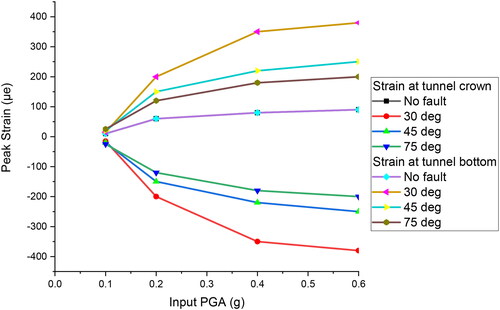
Figure 2. Flowchart for methodology adopted.
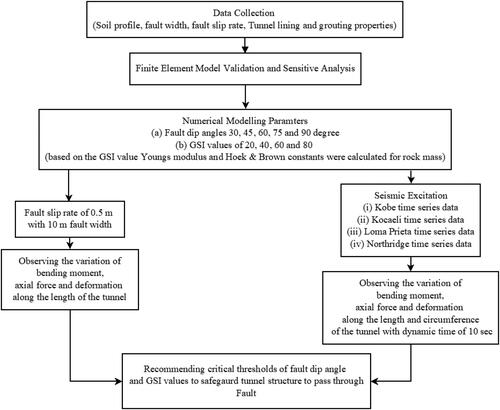
Table 1. Properties of materials.
Figure 3. Numerical model for (a) 30° dip angle, (b) 90° dip angle, and (c) 2D representation of fault movement.
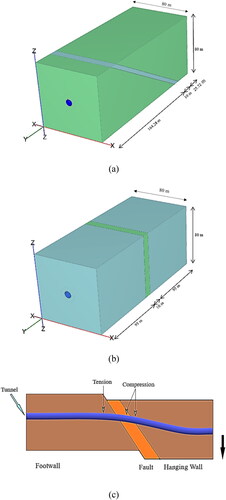
Table 2. Hoek-Brown parameters.
Figure 4. (a) Time history graphs of selected ground motions and (b) displacement Vs time graph for selected ground motions up to 20 sec.
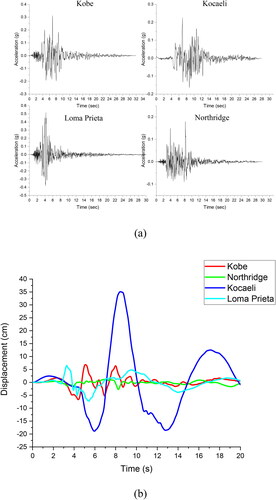
Figure 5. Arias intensity graphs of selected ground motions.
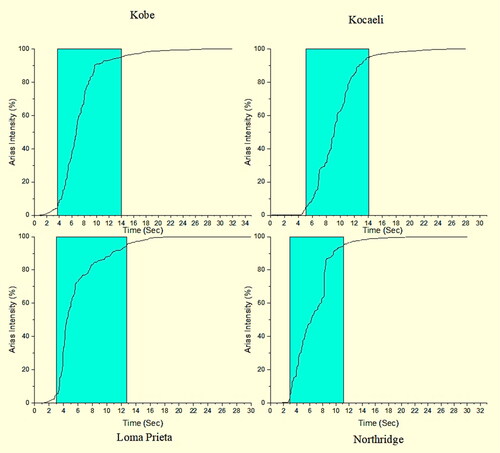
Table 3. Ground motion details.
Figure 6. Bending moment variation along the length of the tunnel for (a) 30° dip, (b) 60° dip, and (c) 90° dip at tunnel crown.
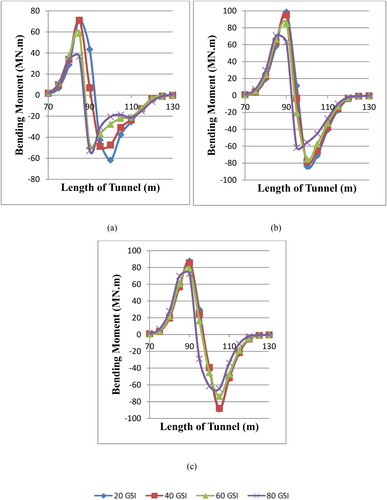
Figure 7. Bending moment variation along the length of the tunnel for (a) 20 GSI and (b) 80 GSI at tunnel crown.
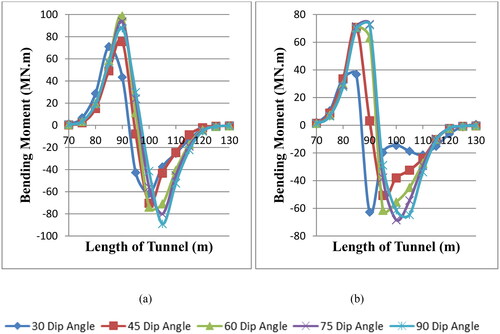
Figure 8. Axial force variation along the length of the tunnel for (a) 30° dip, (b) 60° dip, and (c) 90° dip at tunnel crown.
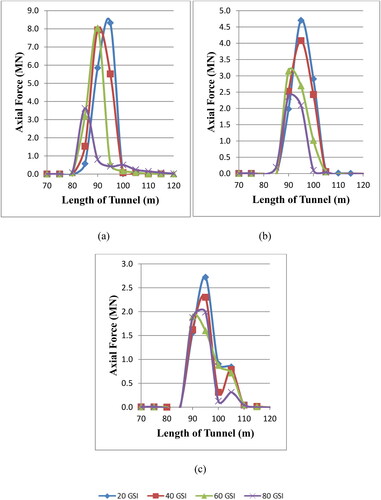
Figure 9. Axial force variation along the length of the tunnel for (a) 20 GSI and (b) 80 GSI at tunnel crown.
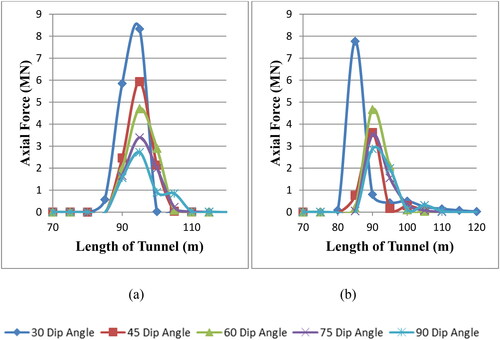
Figure 10. Deformation in tunnel lining for (a) 30° dip angle and (b) 80 GSI.
Figure 11. Bending moment variation along the tunnel circumference for (a) 20 GSI and (b) 80 GSI at 95 m from tunnel portal.
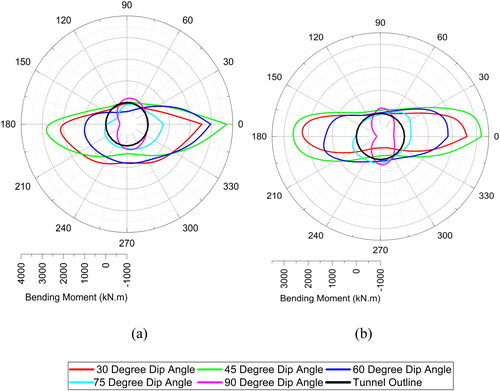
Figure 12. Bending moment variation along the tunnel circumference for (a) 20 GSI and (b) 80 GSI at 105 m from tunnel portal.
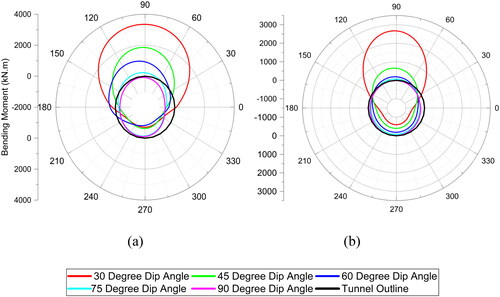
Figure 13. Bending moment variation vs dynamic time at left side of tunnel at (a) 95 m and (b) 105 m from tunnel portal.
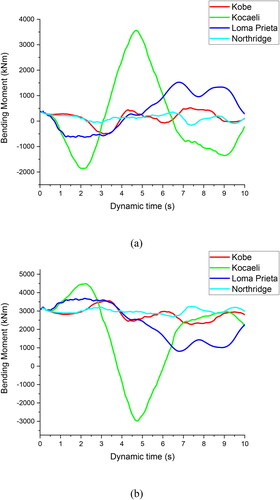
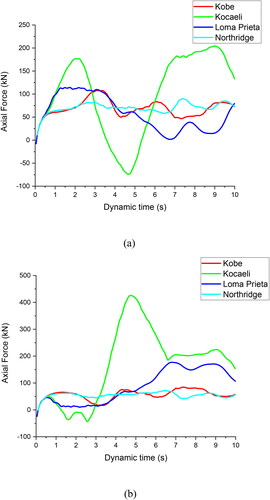
Figure 14. Axial force variation vs dynamic time at left side of tunnel at (a) 95 m and (b) 105 m from tunnel portal.
Data availability statement
The authors confirm that the data supporting the findings of this study are available within the article.