
Figures & data
Figure 1. Tectonic location and topographic map of the study region. (a) Tectonic map of the Tibeten Plateau, Ordos Block, and vicinity; the square shows the location of the study area. (b) Geography of the study area with the locations of sampling sites (triangle), profiles (black line), main faults (red line), and earthquakes epicenters (red circles).
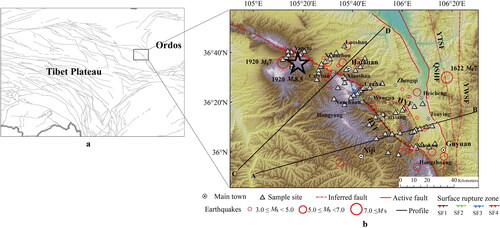
Table 1. Haiyuan fault (HYF) segment characteristics.
Table 2. Statistics of soil gas carbon dioxide (CO2) and radon (Rn).
Figure 2. The schematic diagram of the gas collection system (modified from Chen et al. Citation2018).
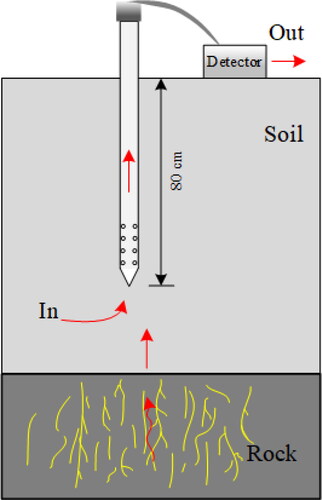
Table 3. F Test of the difference between the predicted value and measured value of soil gas carbon dioxide (CO2) and radon (Rn) interpolated by ordinary kriging (OK) and inverse distance weight (IDW).
Table 4. Evaluation of spatial interpolation precision.
Table 5. Measured concentrations of soil gas carbon dioxide (CO2) and radon (Rn) along the haiyuan fault zone (HYFZ).
Figure 3. Anomaly thresholds of soil gas (a) radon (Rn) and (b) carbon dioxide (CO2) estimated from quantile–quantile (Q–Q) plots.
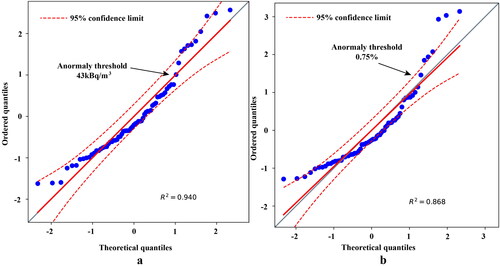
Figure 4. Spatial distribution of soil gas radon (Rn) in the Haiyuan surface rupture zone.
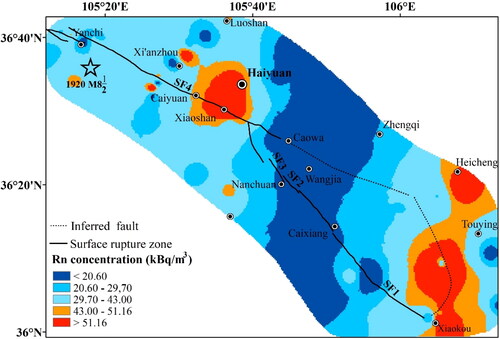
Figure 5. Spatial distribution of soil gas carbon dioxide (CO2) in the Haiyuan surface rupture zone.
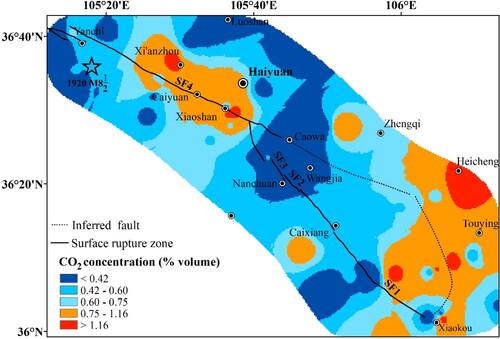
Figure 6. Spatial distributions of b value and gas anomalies in the Haiyuan surface rupture zone.
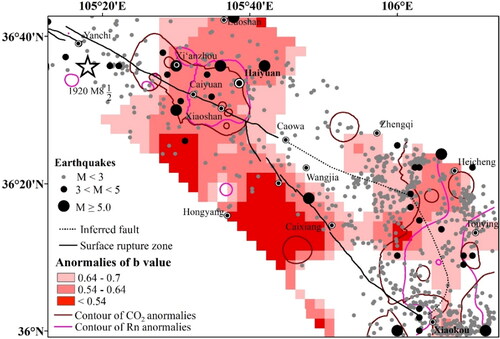
Figure 7. Cross-sectional image of S-wave velocity variation along the a–B (a) and C–D (b) profiles.
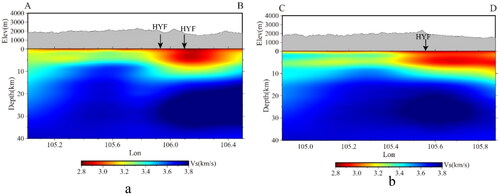
Table 6. Pearson correlations between Rn concentration and environmental parameters.
Data availability statement
The original contributions presented in the study are included in the article/supplementary material, further inquiries can be directed to the corresponding author.