
Figures & data
Figure 1. Geographical location of the SCORE project’s ten case-study coastal urban areas.
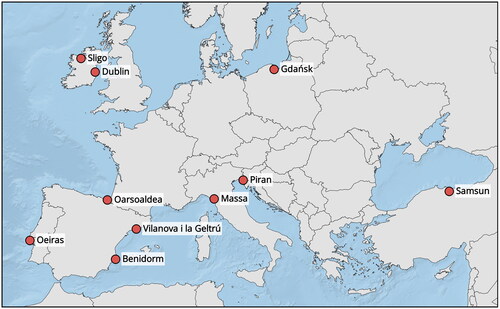
Table 1. Overview of the datasets adopted in this study.
Table 2. Population age distribution for the ten case-study coastal urban areas, based on Eurostat data.
Table 3. Distribution of building height classes and construction materials for the ten case-study coastal urban areas, based on SERA data.
Table 4. Estimated economic activity GVA fractions for the ten case-study coastal urban areas, based on Eurostat data.
Table 5. Adopted reclassification of OSM classes.
Figure 2. Overview of the adopted hazard datasets over a spatial domain covering the ten case-study coastal urban areas: (a) JRC fluvial flood hazard map for a 100-year return period; (b) Aqueduct Floods coastal flood hazard map for a 100-year return period; (c) GPEX precipitation map for a 5-year return period and duration of 24 h; (d) ELSUS v2 landslide susceptibility map; (e) LHASA landslide susceptibility map; (f) UTCI daily maxima: 99th percentile for each grid cell; (g) EUROSION coastal erosion dataset with Coast segments classified according to their evolutionary trend. Descriptions and references are provided in the subsections relative to each hazard.
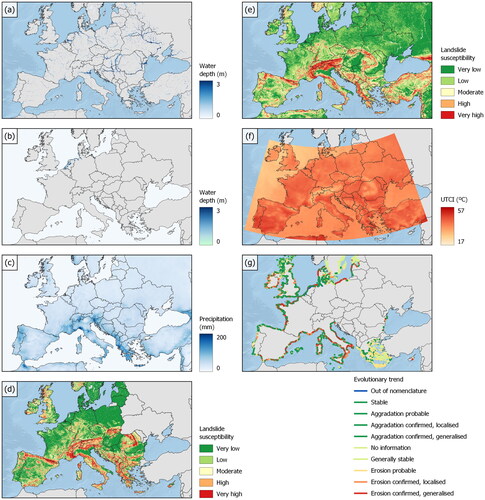
Table 6. Erosion evolutionary trend code descriptions in the EUROSION dataset.
Figure 3. Methodological framework.
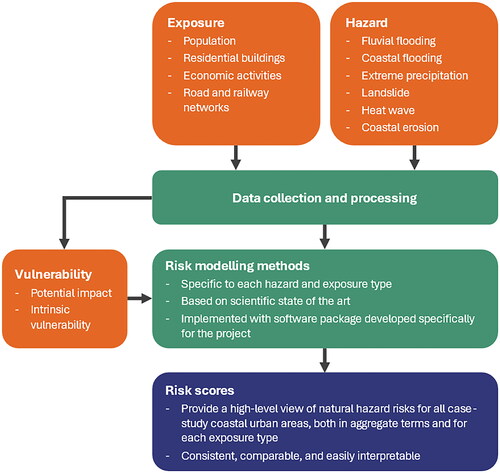
Table 7. Hazard properties: variable adopted for hazard quantification and spatial variability of the hazard at city-scale).
Table 8. Vulnerability indices considered for different age ranges.
Table 9. Vulnerability indices considered for different classes of building properties.
Table 10. Correspondence between economic activities and CLC classes.
Table 11. Flood potential impact indices for road and railway network elements.
Table 12. Correspondence between qualitative landslide susceptibility classes and semi-quantitative susceptibility indices.
Table 13. Correspondence between qualitative coastal erosion susceptibility classes and semi-quantitative susceptibility indices.
Table 14. Risk scores S for each hazard and case-study coastal urban area.
Figure 4. Fluvial flood potential impact indices in Gdańsk: (a) population; (b) residential buildings; (c) agriculture; (d) industry; (e) tourism; (f) road network; (g) railway network.
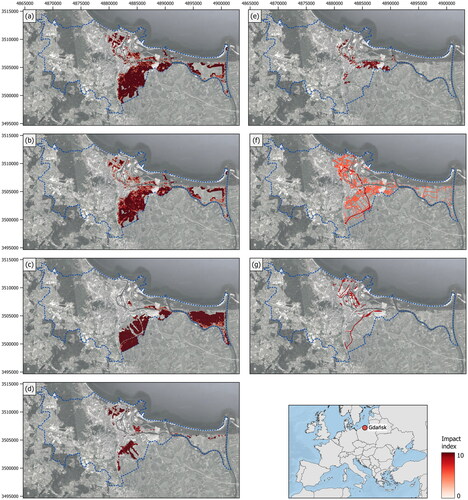
Table 15. Fluvial flooding risk scores, both for each type of exposed element and combined into a single risk score, for each case-study costal urban area.
Table 16. Coastal flooding risk scores both for each type of exposed element and combined into a single risk score for each case-study costal urban area.
Table 17. Extreme precipitation intensities and risk scores for each case-study costal urban area.
Figure 5. Landslide susceptibility indices in Oeiras: (a) population and residential buildings; (b) agriculture; (c) industry; (d) tourism; (e) road network; (f) railway network.
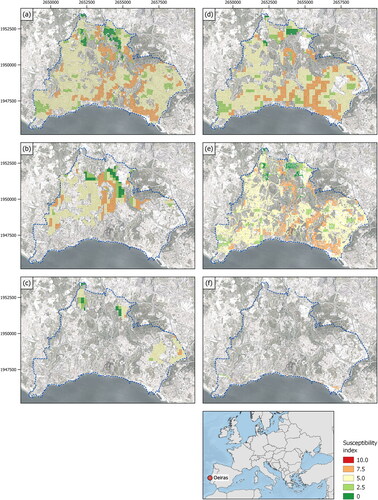
Table 18. Landslide risk scores both for each type of exposed element and combined into a single risk score for each case-study costal urban area.
Table 19. Heat wave Sub-scores and risk scores for each case-study costal urban area.
Table 20. Coastal erosion risk scores both for each type of exposed element and combined into a single risk score for each case-study costal urban area.
SemiQuantitativeRisk_GNHR_supplementary_material.docx
Download MS Word (15.9 MB)Data availability statement
The input raw data used for this study are openly available through the URLs provided in the Data section. The geospatial results that support the computation of the risk scores, as well as additional details on the implementation of the methodology in the R programming language, are available from the corresponding author upon reasonable request.