Figures & data
Table 1. Proximal analysis results of BG, SG, and chitosan. In all samples the variation coefficient (cv) was lower than 5%.
Tabla 1. Resultados del análisis proximal de BG, SG y quitosano. El coeficiente de variación (cv) fue menos de 5% en todas las muestras.
Table 2. Amino acid profile in gelatin of different origin. In all samples the variation coefficient (cv) was lower than 5%.
Tabla 2. Perfil de aminoácido en gelatina de distinto origen. El coeficiente de variación (cv) fue menos de 5% en todas las muestras.
Table 3. Thermal properties determined by DSC in films of BG and SG as a function of chitosan content. Values in bracket correspond to standard deviation between replicates.
Tabla 3. Propiedades térmicas determinadas por DSC en películas de BG y de SG, como función del contenido de quitosano. Los valores en corchetes corresponden a la desviación estándar entre réplicas.
Table 4. p-Value calculated by using a two-way ANOVA test.
Tabla 4. Valor-p calculado mediante una prueba ANOVA de clasificación doble.
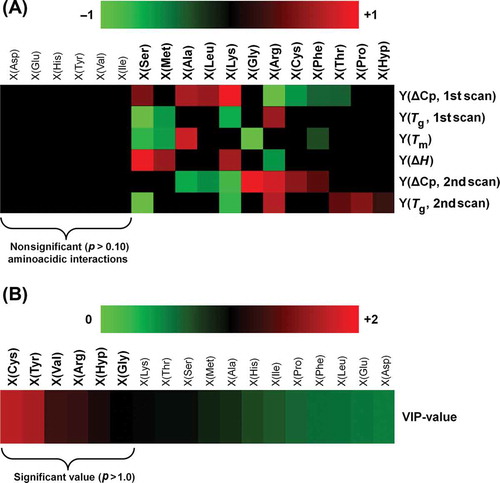
Figure 1. Chemometric analysis of the gelatin–chitosan interaction. (A) Significant coefficients (p < 0.10) of the B matrix calculated by PLSR (coefficients are shown normalized to be visualized in the heat-map). (B) VIP-plot of the X variables (amino acidic interaction with chitosan) shown as heat-map.
Figura 1. Análisis quimiométrico de la interacción gelatina-quitosano. (A) Coeficientes significativos (p < 0,10) de la matriz B calculados por PLSR (los coeficientes aparecen normalizados, a fin de visualizarlos en el mapa de calor). (B) Ploteo VIP de las variables X (interacción de aminoácidos con quitosano) mostrado como mapa de calor.