Figures & data
Table 1. Fatty acids of the human milk in colostrum, transition milk and mature lactation (% of total fatty
Tabla 1. Ácidos grasos de la leche humana en el calostro, la leche de transición y la lactación madura (% del total de ácidos grasos).
Figure 1. The trend of LA, ARA, ALA and DHA in human milk. The contents of LA and ALA increased with the lactation while the ARA and DHA had the opposite trend. The black, blue, red and green represent the trend of LA, ALA, ARA and DHA respectively.
Figura 1. La tendencia de LA, ARA, ALA y DHA en la leche humana. Los contenidos de LA y ALA aumentaron con la lactación mientras que ARA y DHA tuvieron una tendencia opuesta. Los colores negro, azul, rojo y verde representan la tendencia de LA, ALA, ARA y DHA respectivamente.
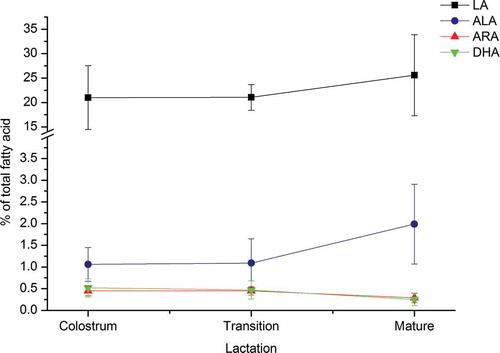
Table 2. Fatty acid of the Holstein bovine milk in colostrum, transition milk and mature lactation (% of total fatty acid).
Tabla 2. Ácidos grasos de la leche bovina Holstein en el calostro, la leche de transición y la lactación madura (% del total de ácidos grasos).
Table 3. Fatty acid in the infant and follow-up (older infants and young children) formula (% of total fatty acid)
Tabla 3. Ácidos grasos en la fórmula infantil (bebés mayores y niños más pequeños) y de continuación (% del total de ácidos grasos).
Table 4. Fatty acids in the human milk, bovine milk and formula milk (% of total fatty acid).
Tabla 4. Ácidos grasos en la leche humana, la leche bovina y la fórmula infantil (% del total de ácidos grasos).
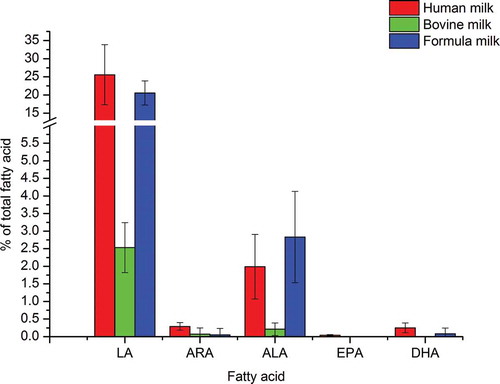
Figure 2. The comparison of essential fatty acid content among human, bovine and formula milk. The red, green and blue represent corresponding values in the human milk, bovine milk and formula respectively. The sequence from left to right are LA, ARA, ALA, EPA and DHA.
Figura 2. Comparación de los contenidos de ácidos grasos esenciales en la leche humana, bovina y la fórmula infantil. Los colores rojo, verde y azul representan los valores correspondientes de la leche humana, bovina y la fórmula infantil respectivamente. La secuencia de izquierda a derecha es LA, ARA, ALA, EPA y DHA.