
Figures & data
Figure 1. Phase-contrast micrographs of myofibrillar protein molecules in 0.6 mol/L (a–f) and 0.2 mol/L KCl (g–l) during heating (bar = 30 μm). (a, g) 0–4°C, (b, h) 25°C, (c, i) 35°C, (d, j) 45°C, (e, k) 55°C, and (f, l) 65°C.
Figura 1. Micrografías de contraste de fase de las moléculas de proteína miofibrilar en 0,6 mol/L (a–f) y 0,2 mol/L de KCl (g–l) durante el calentamiento (barra = 30 μm). (a, g) 0–4°C, (b, h) 25°C, (c, i) 35°C, (d, j) 45°C, (e, k) 55°C, y (f, l) 65°C.
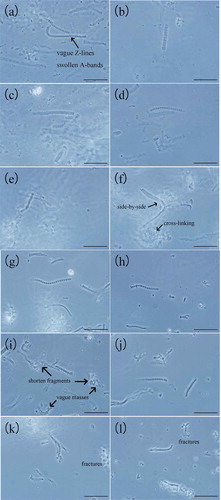
Figure 2. Microstructures of myofibrillar protein molecules in 0.6 mol/L (a–f) and 0.2 mol/L KCl (g–l) during heating (bar = 200 nm). (a, g) 0–4°C, (b, h) 25°C, (c, i) 35°C, (d, j) 45°C, (e, k) 55°C, and (f, l) 65°C.
Figura 2. Microestructuras de las moléculas de proteína miofibrilar en 0,6 mol/L (a–f) y 0,2 mol/L de KCl (g–l) durante el calentamiento (barra = 200 nm). (a, g) 0–4°C, (b, h) 25°C, (c, i) 35°C, (d, j) 45°C, (e, k) 55°C y (f, l) 65°C.
Figure 3. SEM images showing the effect of different denaturation temperatures on myofibrillar proteins in 0.6 mol/L (a–e) and 0.2 mol/L KCl (f–j) (bar = 20 μm). (a, f) 25°C, (b, g) 35°C, (c, h) 45°C, (d, i) 55°C and (e, j) 65°C.
Figura 3. Imágenes SEM que muestran el efecto de las diferentes temperaturas de desnaturalización en las proteínas miofibrilares en 0,6 mol/L (a–e) y 0,2 mol/L de KCl (f–j) (barra = 20 μm). (a, f) 25°C, (b, g) 35°C, (c, h) 45°C, (d, i) 55°C y (e, j) 65°C.
Figure 4. Dynamic rheological test curves of myofibrillar proteins. (a) In 0.6 mol/L KCl and (b) in 0.2 mol/L KCl.
Figura 4. Curvas de los ensayos reológicos dinámicos de las proteínas miofibrilares. (a) en 0,6 mol/L de KCl, (b) en 0,2 mol/L de KCl.
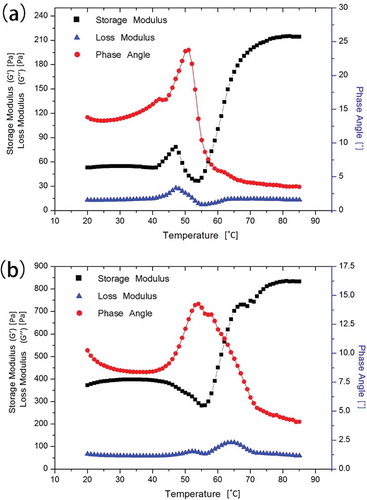
Figure 5. The storage modulus (G′) of PM myofibrillar proteins during cooling from 85 to 20°C at a rate of 5°C/min.
Figura 5. módulo de almacenamiento (G’) de proteínas miofibrilares PM durante enfriamiento de 85°C a 20°C a una velocidad de 5°C/min.
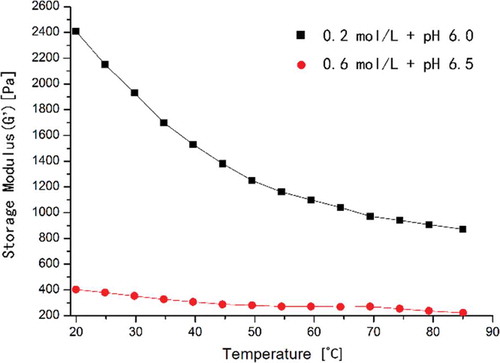
Table 1. WHC and gel strength of the heat-induced myofibrillar protein gel at 65°C and ∆G′ at 80°C.
Tabla 1. WHC y resistencia de gel de la proteína miofibrilar provocado por el calor del gel a 65°C y ∆G’ a 80°C.