
Figures & data
Figure 1. Chemical structures of the ginsenosides 20 (S)-Rh2 and 20 (R)-Rh2.
Figura 1. Estructuras químicas de los ginsenósidos 20 (S)-Rh2 y 20 (R)-Rh2.
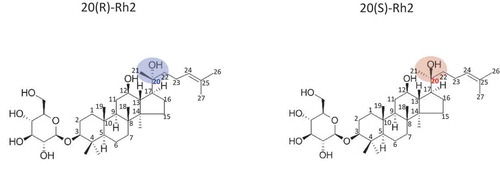
Figure 2. Significant decrease in the viability of human colon cancer cells (HT-29) after treatment of the culture medium with 50 µM of 20 (S)-Rh2 for 72 hours. Treatments with different letters (where a > b) are significantly different at p < .05. Data are expressed as the mean ± SD (n = 3).
Figura 2. Disminución significativa de la viabilidad de las células de cáncer de colon humano (HT-29) después del tratamiento del medio de cultivo con 50 µM de 20 (S)-Rh2 durante 72 horas. Los tratamientos con letras diferentes (donde a > b) son significativamente diferentes en p < .05. Los datos se expresan como la media ± SD (n = 3).
Figure 3. Effect of the treatments 20 (S)-Rh2 (a) and 20 (R)-Rh2 (b) on the viability of HT-29. The viability of the HT-29 cells was assessed by the MTT assay at various concentrations of each molecule 72 hours after the treatment. Treatments with different letters (where a > b) are significantly different at p < 0.05. The data are expressed as the mean ± SD.
Figura 3. Efecto de los tratamientos 20 (S)-Rh2 (a) y 20 (R)-Rh2 (b) sobre la viabilidad de HT-29. La viabilidad de las células HT-29 se valoró mediante el ensayo MTT a diversas concentraciones de cada molécula 72 horas después del tratamiento. Los tratamientos con letras diferentes (donde a > b) son significativamente diferentes en p < 0.05. Los datos se expresan como la media ± DE.
Figure 4. Analysis of the RTCA profile of HT-29 cells in the presence of ginsenosides (a) 20 (S)-Rh2 and (b) 20 (R)-Rh2. HT-29 cells were seeded in the wells of a 96-well plate and treated with different concentrations of two different types of Rh2 ginsenoside (10, 25, 50 and 75 µM) and the control vehicle (0.1% DMSO [v. / v]). The viability of the cells was monitored continuously using an RTCA system for 72 hours and showed normalized IC values, which were recorded every 30 minutes. The trace for each concentration was obtained as an average of three repetitions.
Figura 4. Análisis del perfil RTCA de las células HT-29 en presencia de ginsenósidos (a) 20 (S)-Rh2 y (b) 20 (R)-Rh2. Se sembraron células HT-29 en los pocillos de una placa de 96 pocillos y se las trató con diferentes concentraciones de dos tipos diferentes de ginsenósido Rh2 (10, 25, 50 y 75 µM) y el vehículo de control (DMSO 0.1% [v/v]). La viabilidad de las células se controló de manera continua empleando para ello un sistema RTCA durante 72 horas y se mostró como valores de CI normalizados, mismos que se registraron cada 30 minutos. La traza para cada concentración se obtuvo como un promedio de tres repeticiones.
![Figure 4. Analysis of the RTCA profile of HT-29 cells in the presence of ginsenosides (a) 20 (S)-Rh2 and (b) 20 (R)-Rh2. HT-29 cells were seeded in the wells of a 96-well plate and treated with different concentrations of two different types of Rh2 ginsenoside (10, 25, 50 and 75 µM) and the control vehicle (0.1% DMSO [v. / v]). The viability of the cells was monitored continuously using an RTCA system for 72 hours and showed normalized IC values, which were recorded every 30 minutes. The trace for each concentration was obtained as an average of three repetitions.Figura 4. Análisis del perfil RTCA de las células HT-29 en presencia de ginsenósidos (a) 20 (S)-Rh2 y (b) 20 (R)-Rh2. Se sembraron células HT-29 en los pocillos de una placa de 96 pocillos y se las trató con diferentes concentraciones de dos tipos diferentes de ginsenósido Rh2 (10, 25, 50 y 75 µM) y el vehículo de control (DMSO 0.1% [v/v]). La viabilidad de las células se controló de manera continua empleando para ello un sistema RTCA durante 72 horas y se mostró como valores de CI normalizados, mismos que se registraron cada 30 minutos. La traza para cada concentración se obtuvo como un promedio de tres repeticiones.](/cms/asset/50dbc548-ae6d-4ff0-ae30-90219d4017c8/tcyt_a_1607562_f0004_oc.jpg)