Figures & data
Figure 1. The structures of 1,3-dioleoyl-2-palmitoylglycerol (OPO) (a) and 1,3-palmitoylglycerol-2-dioleoyl (POP) (b) the different structure between OPO and POP was marked with red text box.
Figura 1. Estructuras de 1,3-dioleoil-2-palmitoilglicerol (OPO) (a) y 1,3-palmitoilglicerol-2-dioleoil (POP) (b). La estructura diferente entre OPO y POP se indicó con un cuadro de texto rojo.
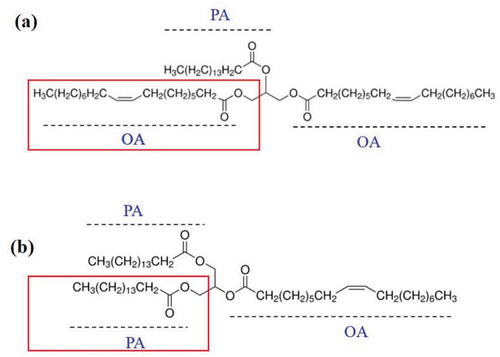
Figure 2. Schematic diagram of the research study.
Figura 2. Diagrama esquemático del estudio de investigación.
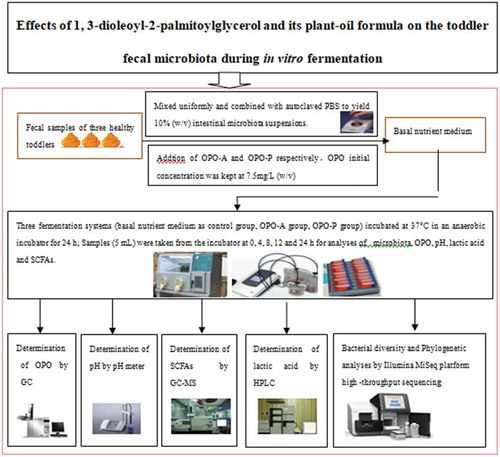
Figure 3. Percentage of OPO remaining in the fermentation systems containing OPO-A or OPO-P at different fermentation time points.
Figura 3. Porcentaje de OPO restante en los sistemas de fermentación que contienen OPO-A u OPO-P en diferentes momentos de la fermentación.
Figure 4. Changes in pH in the fermentation systems containing OPO-A or OPO-P or with no addition (Control) at different fermentation time points.
Figura 4. Cambios en el pH en los sistemas de fermentación que contienen OPO-A u OPO-P o sin adición (control) en diferentes momentos de la fermentación.
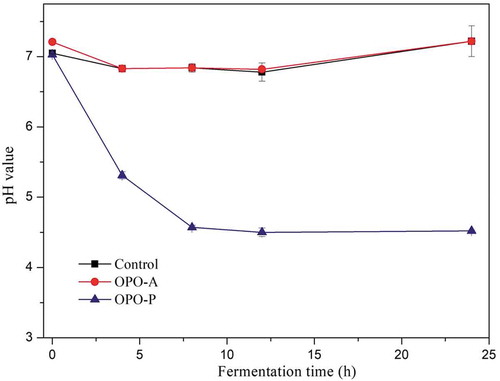
Table 1. The concentrations (μg/mL) of SCFAs and lactic acid in different fermentation solutions (control, OPO-A and OPO-P groups) at different fermentation time points.
Tabla 1. Concentraciones (μg/mL) de SCFA y ácido láctico en diferentes soluciones de fermentación (control, grupos OPO-A y OPO-P) en diferentes momentos de la fermentación.
Figure 5. Rarefaction index curves (a) and Shannon index curves (b) of all studied samples.
Figura 5. Curvas de índice de rarefacción (a) y curvas de índice de Shannon (b) de todas las muestras estudiadas.
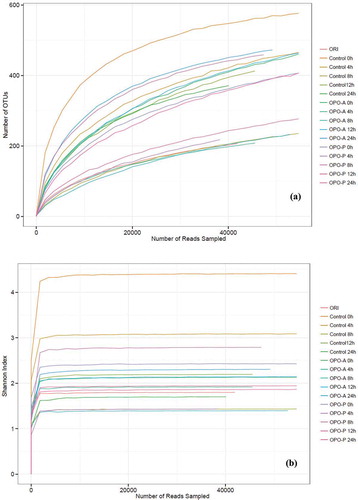
Table 2. Richness and α-diversity of each studied sample.
Tabla 2. Riqueza y diversidad α de cada muestra estudiada.
Table 3. Comparison (%) of bacterial clone libraries at the phylum and genus levels for the control, OPO-A and OPO-P fermentation systems at different fermentation time points.
Tabla 3. Comparación (%) de bibliotecas de clones bacterianos a nivel de phylum y género para el control y los sistemas de fermentación OPO-A y OPO-P en diferentes momentos de la fermentación.
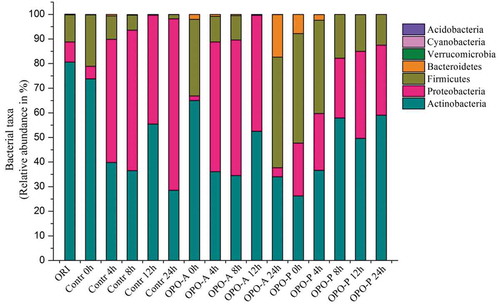
Figure 6. Intestinal microbiota composition at the phylum level of the control, OPO-A and OPO-P fermentation systems at different fermentation time points.
Figura 6. Composición de microbiota intestinal a nivel de phylum del control, de sistemas de fermentación OPO-A y OPO-P en diferentes momentos de la fermentación.