
Figures & data
Table 1. The Primer sequences of the established real-time LAMP assay and reported TaqManTM PCR assay.
Tabla 1. Secuencias del cebador del ensayo LAMP en tiempo real y el ensayo PCR TaqManTM reportado
Figure 1. The LAMP assay reactions at 61°C, 62°C, 63°C and 64°C for 1 hr.
Figura 1. Reacciones del ensayo LAMP a 61°C, 62°C, 63°C y 64°C durante 1 hora
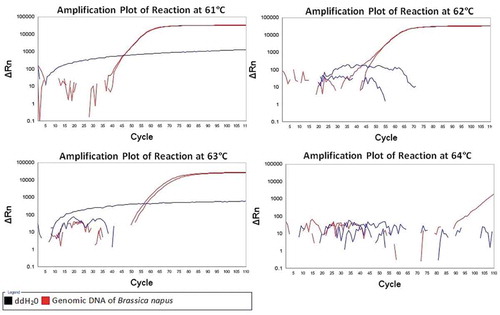
Figure 2. Specificity of the real-time LAMP assay.
Figura 2. Especificidad del ensayo LAMP en tiempo real
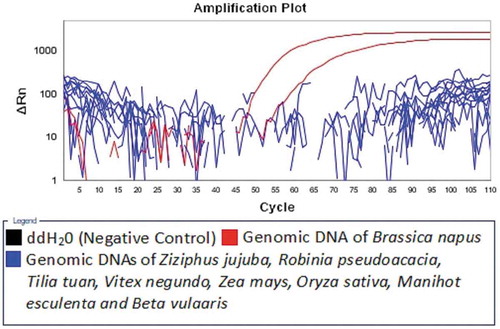
Figure 3. Detection limit of the established real-time LAMP Assay.
Figura 3. Límite de detección del ensayo LAMP en tiempo real
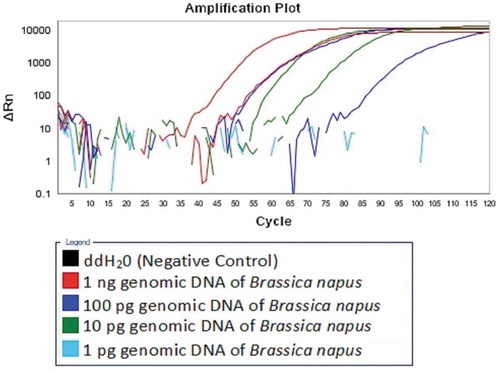
Table 2. Detection of Brassica napus component in monofloral honey samples.
Tabla 2. Detección del componente Brassica napus en muestras de miel monofloral