
Figures & data
Figure 1. The flow chart of production of cassava flour.
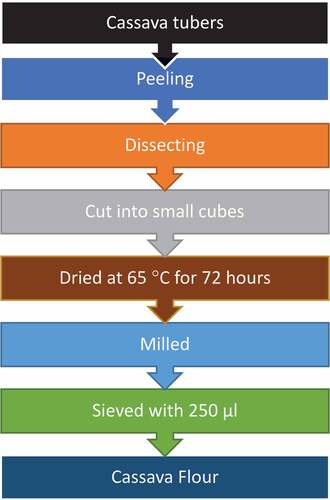
Figure 2. The flow chart of production of gari.
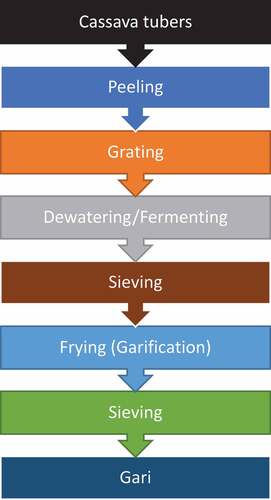
Table 1. Total hydrogen cyanide content in fresh cassava root.
Table 2. Proximate composition of twenty different cassava cultivars flours.
Table 3. Carbohydrate compositions of twenty cassava cultivars flours.
Table 4. Total hydrogen cyanide in gari.
Table 5. Proximate composition of gari.
Table 6. Carbohydrate composition of gari for four varieties of cassava in Ibadan.
Figure 3. Postprandial blood glucose response of reference food and the test food eba for the four varieties of gari.
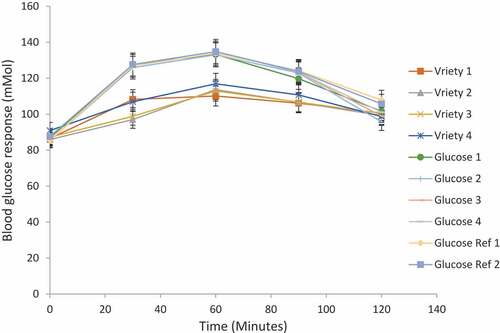
Table 7. The postprandial blood glucose responses of eba and the reference food.
Data availability statement
The data supporting this study’s findings are available on request from the corresponding author.