Figures & data
Figure 1. Appearance of Daqu samples from different geographical origins. a) Strong-flavor Daqu (SFD) from Yi-Bin city (YB), b) SFD from Lu-Zhou city (LZ), c) SFD from Ji-Ning city (JN), d) SFD from Bo-Zhou city (BZ), e) SFD from Fu-Yang city (FY), f) SFD from Lin-Quan city (LQ).
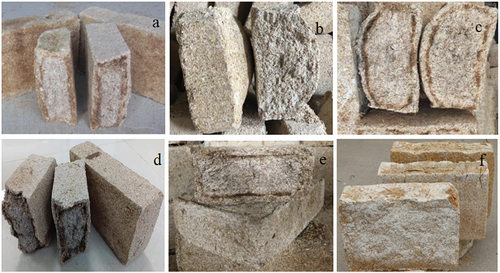
Figure 2. Schematic representation of sampling positions in Daqu.
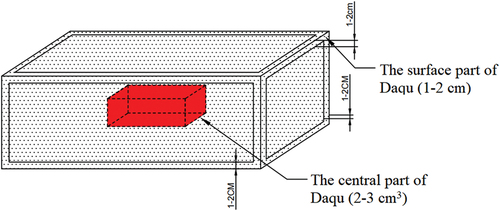
Table 1. Alpha diversity indices of fungal metagenomes of Strong-flavor Daqu samples from different geographical locations in China.
Table 2. Alpha diversity indices of bacterial metagenomes of Strong-flavor Daqu samples from different geographical locations in China.
Figure 3. Histogram of relative abundance at phylum level of microorganisms found in Daqu. a) Fungal phyla across the surface (S) and central (I) parts of Daqu samples, b) Fungal phyla across different Daqu samples, c) Bacterial phyla across S and I parts of Daqu, d) Bacterial phyla across different Daqu samples.
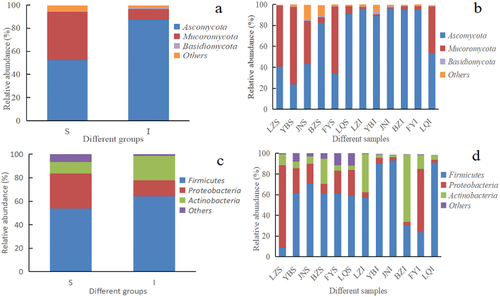
Figure 4. Histogram of relative abundance at genus level of microorganisms found in Daqu. a) Fungal genera across the surface (S) and central (I) parts of Daqu samples, b) Fungal genera across different Daqu samples, c) Bacterial genera across S and I parts of Daqu samples, d) Bacterial genera across different Daqu samples.
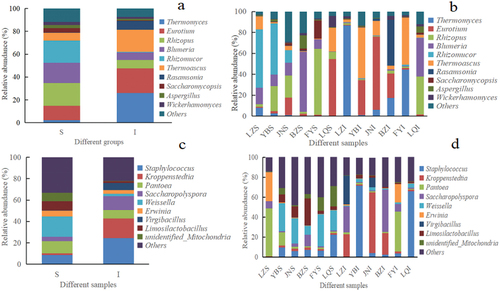
Figure 5. Inter group T-test at genus level of microorganisms found in Daqu samples. a) Fungi, b) Bacteria. Each bar in represents the mean of species with significant differences in abundance between sample groups (surface part of Daqu, S, central part of Daqu, I). The leftmost endpoint of each circle represents the mean difference of the lower limit of the 95% confidence interval, the rightmost end of the circle represents the upper limit of the 95% confidence interval of the mean difference, the center of the circle represents the difference between means, the group represented by the color of the circle is the group with the highest mean, and the far right end of the displayed result is the corresponding difference between p values for species.
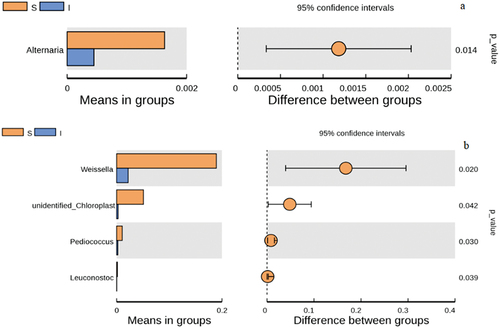
Figure 6. Principal coordinate analysis (PCoA) of microbial communities based on weighted UniFrac distances. a) Fungi, b) Bacteria. Data points are colored by sample type.
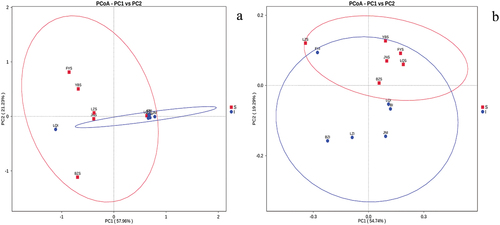
Table 3. Quality indicator parameters of Strong-flavor Daqu samples from different geographical locations in China.
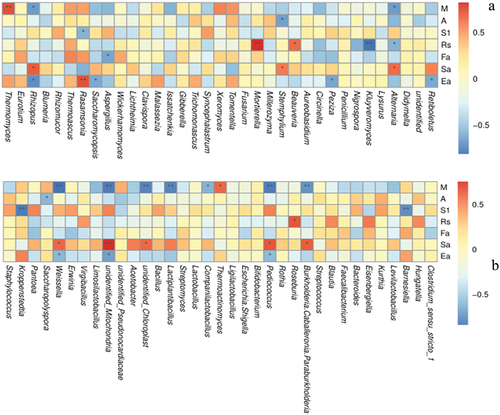
Figure 7. Spearman correlation analysis of genus-level microbial community structure and physicochemical parameters. a) Fungi, b) Bacteria. Environmental factor information is given vertically, species information is given horizontally. Values in the middle of the heat map are Spearman correlation coefficients (r), which are between −1 and 1, r < 0 indicates a negative correlation, r > 0 indicates a positive correlation, * indicates p values < .05, ** indicates p values < .01. M: moisture content, A: acidity, S1: starch, Rs: reducing sugar content, Fa: fermentation power, Sa: saccharification ability, Ea: esterification ability.