
Figures & data
Figure 1. Chemical structures of myricetin and quercetin.
Figure 2. 3D Figures posing the molecular interactions of ligand-protein myricetin(1a) and quercetin(1b) with HMG CoA reductase studied through docking analysis. The dotted line indicates the hydrogen bond interactions.
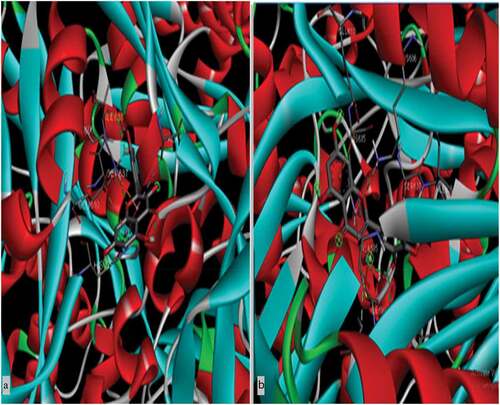
Figure 3. 2D figures posing the ligand-protein interactions of Myricetin(2a) and Quercetin(2b) with HMG CoA reductase.
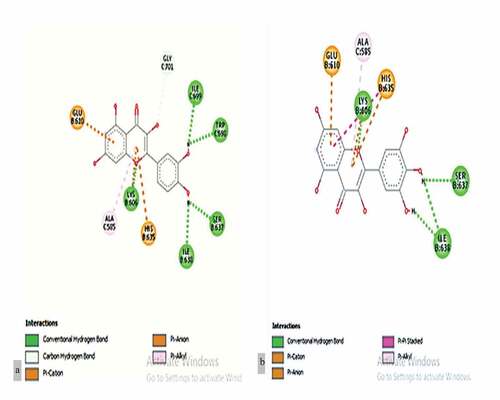
Table 1. Molecular docking of myricetin and quercetin compound against target enzyme of HMG CoA reductase.
Table 2. Pharmacokinetics ADMET predictions of myricetin and quercetin by SwissADME.
Table 3. In silico toxicity study of myricetin and quercetin compound by ProTox-II.
Figure 4. Myricetin and quercetin interaction energies with HMGCR.
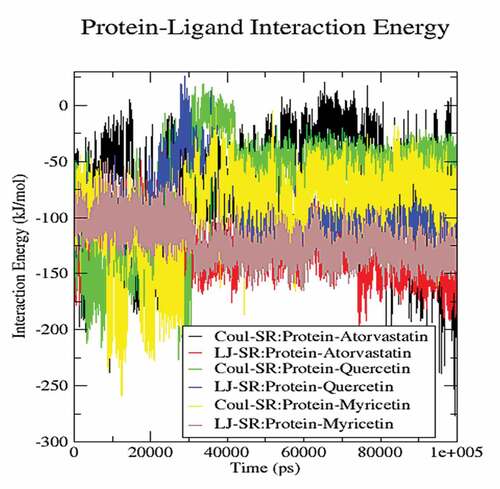
Figure 5. Free energy of solvation of myricetin and quercetin with HMGCR.
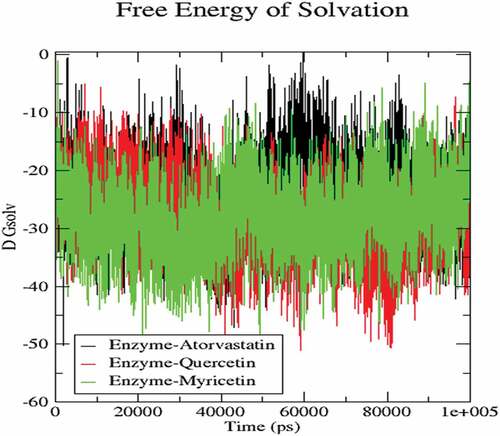
Figure 6. RSMF calculation of myricetin and quercetin with HMGCR.
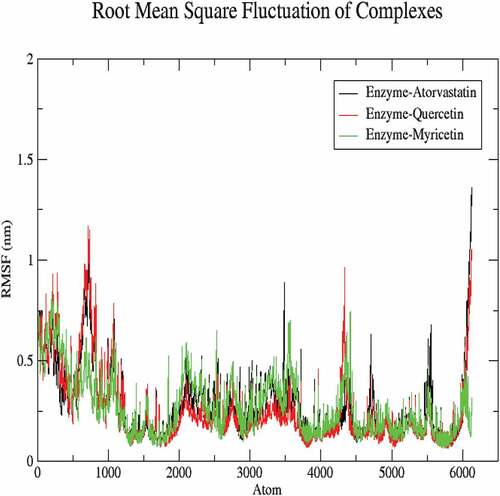
Figure 7. Calculation of SASA for myricetin and quercetin with HMGCR.
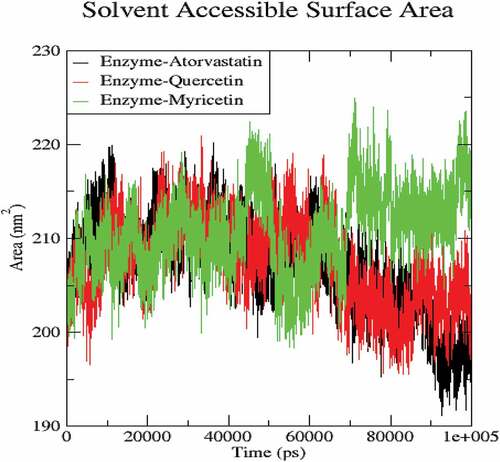
Figure 8. Calculation of radius of gyration for myricetin and quercetin with HMGCR.
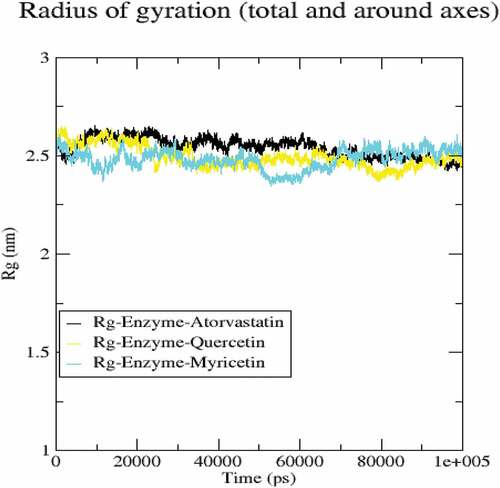
Figure 9. RSMD calculation of myricetin and quercetin with HMGCR.
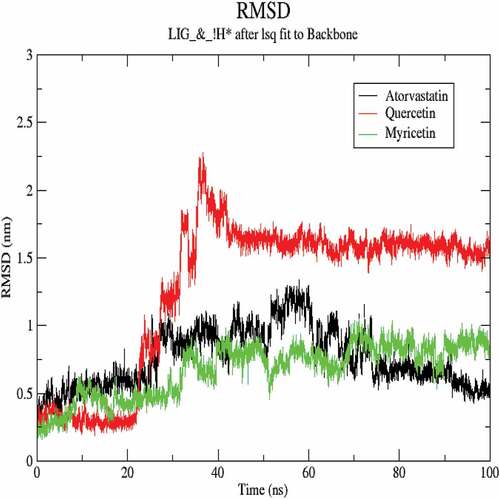
Figure 10. Effect of treatments of myricetin and quercetin on lipid profile. Data are means ± S.E.M. (n = 5); c P ≤ .001 as significant; and d was non-significant as compared to the respective control values. g P ≤ .001 as significant; and h was non-significant as compared to the respective values of the hypercholesterolemic control group.
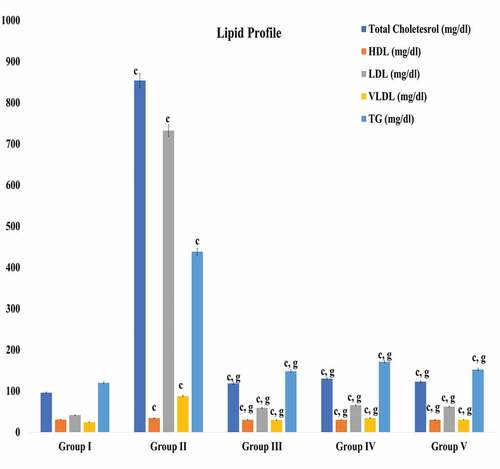
Figure 11. Effect of treatments of myricetin and quercetin on lipid profile. Data are means ± S.E.M. (n = 5); c P ≤ .001 as significant; and d was non-significant as compared to the respective control values. g P ≤ .001 as significant; and h was non-significant as compared to the respective values of the hypercholesterolemic control group.
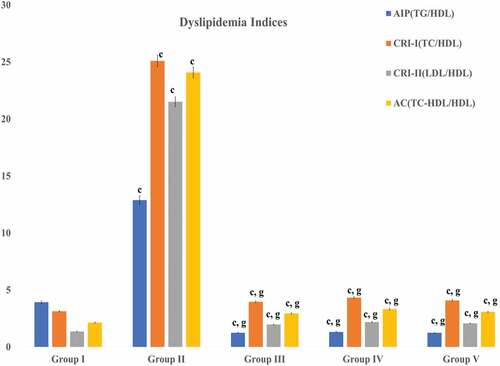
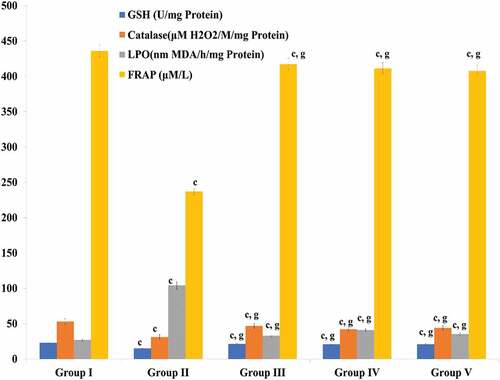
Figure 12. Effect of treatments of myricetin and quercetin on oxidative stress. Data are means ± S.E.M. (n = 5); c P ≤ .001 as significant; and d was non-significant as compared to the respective control values. g P ≤ .001 as significant; and h was non-significant as compared to the respective values of the hypercholesterolemic control group.
Data availability statement
The data have already been incorporated into the manuscript.