
Figures & data
Figure 1. Scanning electron micrographs (SEM) of mucilage from wild Opuntia robusta at 250x (a), 1000x (b) and 5000x (c).
Table 1. Mineral composition of mucilage powder determined by Energy Dispersive X-rays Spectroscopy. Data are presented as mean (n = 3) ± SD.
Figure 2. Macroscopic shape of microcapsules obtained from alginate (Alg) and from alginate-mucilage mixtures at different ratios (AM 2:1, AM 1:1, and AM 1:2).

Figure 3. Graphs of (a) Sizes and (b) Weights of the microcapsules made from alginate (Alg) and alginate-mucilage mixtures (AM 2:1, AM 1:1). The results are presented as mean (n = 50) ± SD.
Table 2. Encapsulation efficiency and viability after three months of L. plantarum 1449 in Alg and AM mixtures.
Figure 4. Color parameters: (a) L*, (b) a* and (c) b* of the microcapsules made from Alg and AM 2:1, AM 1:1 and AM 1:2 mixtures. L*, a*, and b* data are the mean of measured values (n = 5) ± SD. Different letters for each color parameter indicate statistical differences (p < .05).
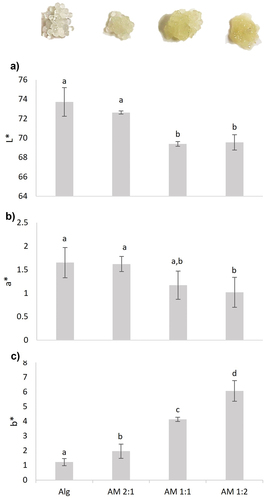
Table 3. Color parameters (L*, a*, b*and ΔE*) of the obtained microcapsules. The data are the mean of measured values (n = 5) ± SD.