Figures & data
Figure 1. Qualitative phytochemical screening and anthocyanin and proanthocyanidin profiles based on thin-layer chromatography. a. Phytochemical identification, b. Phytochemical distribution, c. Qualitative anthocyanin and proanthocyanidin profiles. Three samples (BREJ Mentik 1, BRCJ Melik 1, BRWJ Toraja) were obtained from Fatchiyah et al. (Stintzing et al., Citation2002).
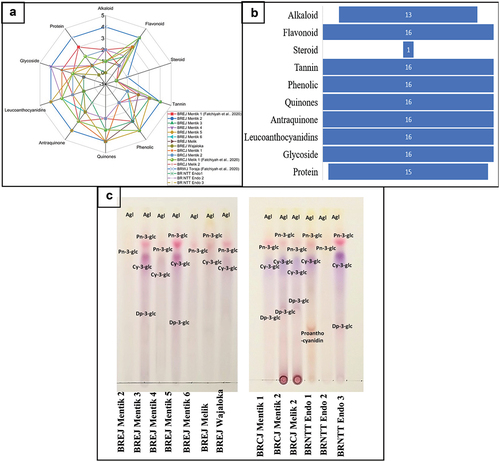
Table 1. Anthocyanin prediction for black rice cultivars. Tukey’s HSD test was conducted in Graphpad Prism 9.3.1; significant differences are indicated by different letters (p < .05).
Figure 2. Anthocyanin characterization based on UV – Vis spectroscopy. A. pH 1, B. pH 4.5, C. Total anthocyanin content of black rice extracts. Tukey’s HSD test was conducted in Graphpad Prism 9.3.1; significant differences are indicated by different letters (p < .05).
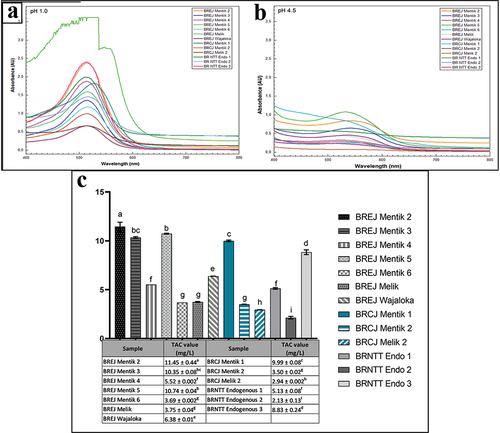
Table 2. Maximum wavelength and absorbance of spectral profiles at pH 1 and 4.5.
Figure 3. FTIR chromatogram of Mentik and Melik black rice cultivars.
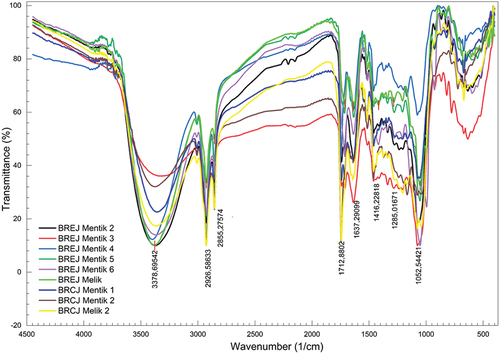
Figure 4. FTIR chromatogram of Wajaloka and NTT black rice cultivars.
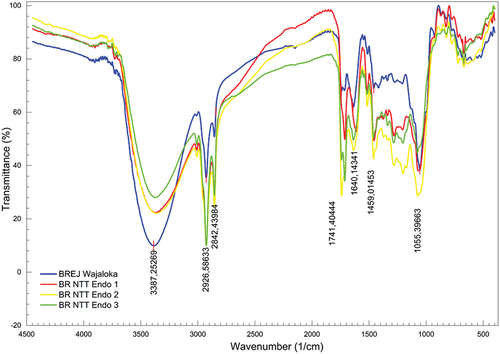
Table 3. Wavenumbers and functional groups of the spectra of the Mentik and Melik black rice cultivars.
Table 4. Wavenumber and functional groups of the spectra of the Wajaloka and NTT black rice cultivars.
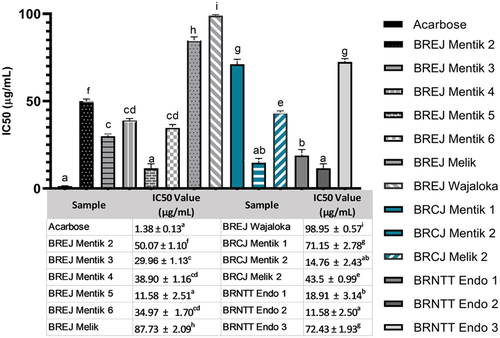
Figure 5. Antioxidant activities of the 13 black rice cultivars assigned as the IC50 value. The designations of the samples correspond to those in the methods section. Tukey’s HSD test was conducted in Graphpad Prism 9.3.1; significant differences are indicated by different letters (p < .05).
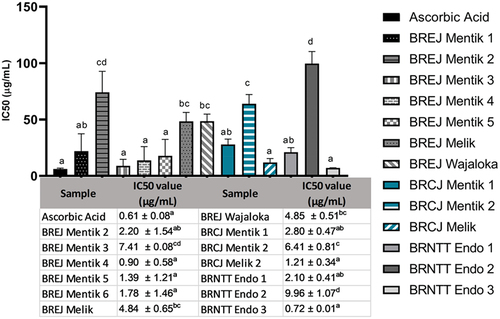
Figure 6. Alpha amylase inhibition activities of the black rice extracts. The designations of the samples correspond to those in the methods section. Tukey’s HSD test was conducted in Graphpad Prism 9.3.1; significant differences are indicated by different letters (p < .05).