
Figures & data
Table 1. Ingredients for fried dough (in grams).
Figure 1. Effects of pectin and xanthan gum on the moisture content of the fried dough. Bars with superscripts in uppercase (X – Z) in the category show significant difference (P < 0.05) among samples within the same day, while bars with superscripts in lowercase (a – c) in the series show significant difference (P < 0.05) within the same sample from day 1 to day 3 using Duncan’s multiple range tests. PM and XGM represent magwinya with pectin and xanthan gum.
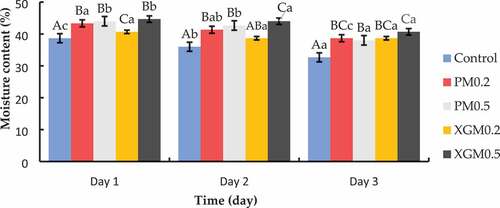
Figure 2. Effects of pectin and xanthan gum on the water activity of fried dough. Bars with superscripts in uppercase (A-E) in the category show significant differences (P < 0.05) among samples within the same day, while bars with superscripts in lowercase (a–c) in the series show significant differences (P < 0.05) within the same sample from day 1 to day 3 using Duncan’s multiple range tests. PM and XGM represent magwinya with pectin and xanthan gum.
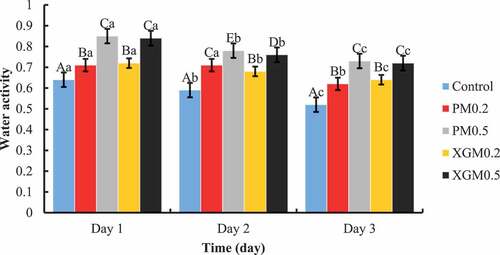
Figure 3. Effects of pectin and xanthan gum on the fat content of magwinya. Bars with different superscripts show a significant difference (P < 0.05) among the samples using the Duncan range test. PM and XGM represent pectin and xanthan gum samples.
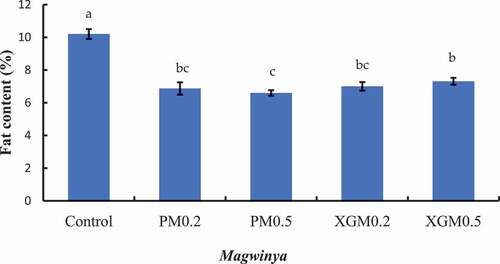
Table 2. Peroxide value of fried dough samples from day 1 to day 3 of storage.
Table 3. Crumb texture profile of fried dough samples over 3 days of storage.
Table 4. Crust-to-crumb texture profile of fried dough samples over 3 days of storage.
Figure 4. Fried dough samples (XG – xanthan gum, PC – pectin).
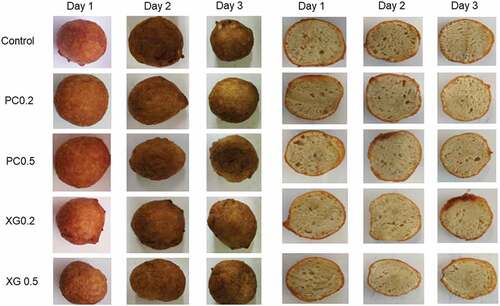
Table 5. Crust colour profile of fried dough samples over 3 days of storage.
Table 6. Crumb colour profile of fried dough samples over 3 days of storage.