
Figures & data
Figure 1. Cookies produced from the composite flours.
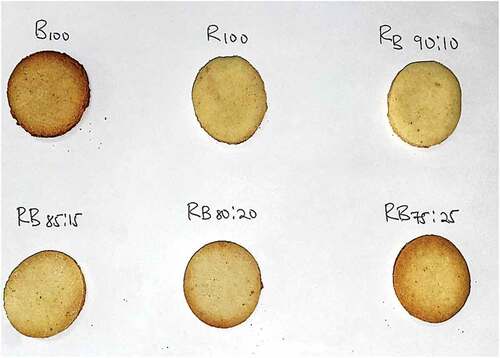
Table 1. Proximate Composition of Flours.
Table 2. Functional Properties of Flours.
Figure 2. Swelling Capacity (ml) of flour at 27°C.
B100%=100% Bambara groundnut flour, R100%=100% Rice flour, RB90:10=90% Rice flour 10% Bambara groundnut flour, RB85:15=85% Rice flour 15% Bambara groundnut flour, RB80:20=80% Rice flour 20% Bambara groundnut flour, RB75:25=75% Rice flour 25% Bambara groundnut flour.
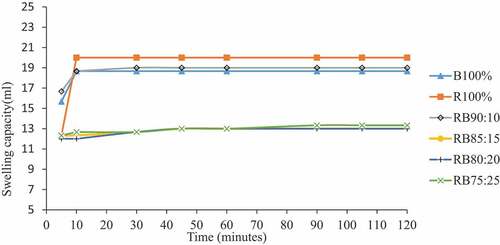
Figure 3. Swelling Capacity (ml) of flour at 70°C.
B100%=100% Bambara groundnut flour, R100%=100% Rice flour, RB90:10=90% Rice flour 10% Bambara groundnut flour, RB85:15=85% Rice flour 15% Bambara groundnut flour, RB80:20=80% Rice flour 20% Bambara groundnut flour, RB75:25=75% Rice flour 25% Bambara groundnut flour.
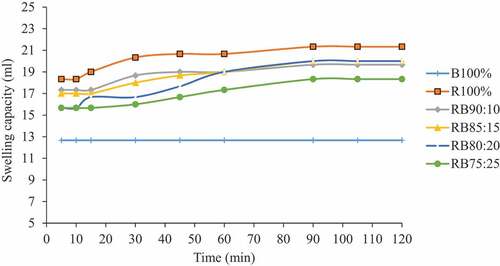
Table 3. Least Gelation Concentration of flours.
Table 4. pH of flours.
Table 5. Colour of flours.
Table 6. Physical characteristics of cookies.
Table 7. Sensory characteristics of cookies.
Data availability statement
The authors declare that the data supporting the findings of the study entitled “Quality Assessment of Gluten-Free Cookies from Rice and Bambara Groundnut flour” are available within this article.